Choppiness Index H
This professional-grade solution for MetaTrader 5 helps traders achieve greater efficiency in their daily workflow. This technical indicator acts as a specialized analysis tool designed to visualize market data. It helps traders identify emerging trends, momentum shifts, and key support or resistance levels by plotting statistical calculations directly onto price charts.
How to Setup and Use Choppiness Index H
1. Installation: Place your file in the MQL/Indicators folder via "Open Data Folder" and restart your terminal.
2. Loading: Find the indicator in the Navigator, drag it onto your chart, and configure the input parameters in the popup window.
3. Customization: Press Ctrl+I to open the indicator list, select your tool, and click "Properties" to change colors, levels, or visual styles.
4. Updating: Replace the old file in the Indicators folder with the new version and restart the platform to apply changes.
Frequently Asked Questions
Q: Why is my indicator not showing? A: Verify the file is in the MQL/Indicators folder, or try right-clicking the "Indicators" tree in the Navigator and clicking "Refresh."
Q: Do custom indicators slow down the platform? A: Too many complex indicators can impact performance; remove unused ones via the "Indicator List" (Ctrl+I).
Q: Can I use MT4 indicators on MT5? A: No, MQL4 and MQL5 are distinct languages; ensure the indicator is compiled specifically for your platform version.
Description & Settings
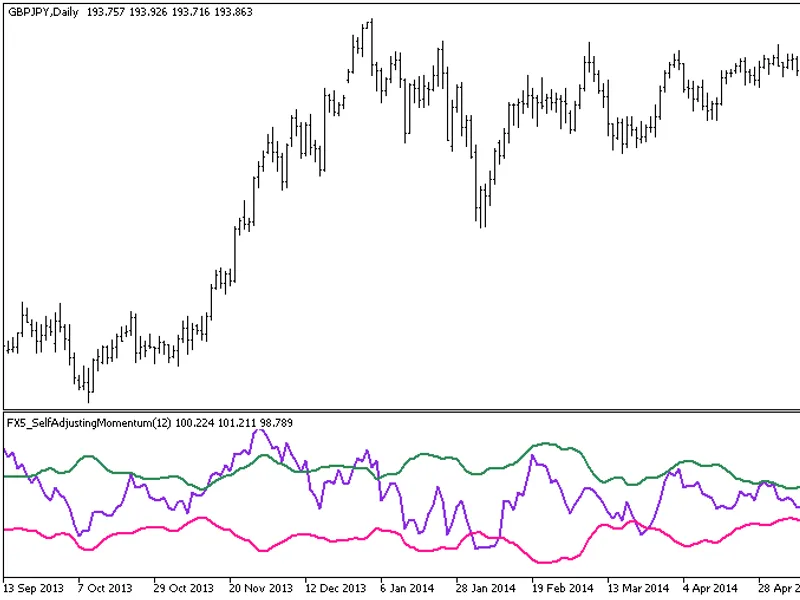
Oscillator is intended for assessing the market situation. It identifies three states:
Trend
Flat
Instable consolidation
This indicator is made as an oscillating histogram with the zero central point.
The indicator informs on the market state with the different colors of the histogram bars:
Trend is displayed in
green
Starting/ending trend is displayed in
pale green
Transition from trend to flat or from flat to trend is displayed in
pale blue
Flat is displayed in
blue
Instable consolidation is displayed in
red
Values below -11.8 indicates a trend in the market, while values above 11.8 indicate a flat. Values close to 50 indicate an instable consolidation.The lower the oscillator value is within the negative area, the more expressed the trend component is on the market.
The indicator has four configured parameters:
Period
- calculation period
Trend level
- trend boundary level
Choppiness level
- flat boundary level
Consolidation level
- consolidation boundary level
Calculations:
where: