Range Vector Fibo Logic (Indicator) - One Candle Strategy
What this tool does
The Range Vector Fibo Logic (Indicator) - One Candle Strategy is a Indicator for MetaTrader 5 that range vector fibo logic (indicator) — one candle strategyidea of the indicator, stop waking up at 3 am to draw lines manually. This is the professional visual tool for the popular “One Candle” and “Daily Breakout” strategies used by institutional traders.
Typical Use Case
This tool is typically used for enhancing chart analysis and decision making.
Compatible Platform
This Indicator works exclusively on MetaTrader 5 (both build 600+ and newer versions).
Setup Location
Place the downloaded file in MQL5/Indicators folder via File ? Open Data Folder in MetaTrader 5.
How to Install and Use Range Vector Fibo Logic (Indicator) - One Candle Strategy
1. Installation: Place your file in the MQL/Indicators folder via "Open Data Folder" and restart your terminal.
2. Loading: Find the indicator in the Navigator, drag it onto your chart, and configure the input parameters in the popup window.
3. Customization: Press Ctrl+I to open the indicator list, select your tool, and click "Properties" to change colors, levels, or visual styles.
4. Updating: Replace the old file in the Indicators folder with the new version and restart the platform to apply changes.
Frequently Asked Questions
Q: Why is my indicator not showing? A: Verify the file is in the MQL/Indicators folder, or try right-clicking the "Indicators" tree in the Navigator and clicking "Refresh."
Q: Do custom indicators slow down the platform? A: Too many complex indicators can impact performance; remove unused ones via the "Indicator List" (Ctrl+I).
Q: Can I use MT4 indicators on MT5? A: No, MQL4 and MQL5 are distinct languages; ensure the indicator is compiled specifically for your platform version.
Description & Settings
Range Vector Fibo Logic (Indicator) — One Candle Strategy
Idea of the Indicator, Stop waking up at 3 AM to draw lines manually. This is the professional visual tool for the popular “One Candle” and “Daily Breakout” strategies used by institutional traders. If you are trading the viral Daily High/Low Breakout strategy, this tool automates the analysis. It instantly projects the Vector Breakout Levels, Stop Loss Zones, and Fibonacci Profit Targets for the current day based on yesterday's volatility.
How to Interpret the Indications
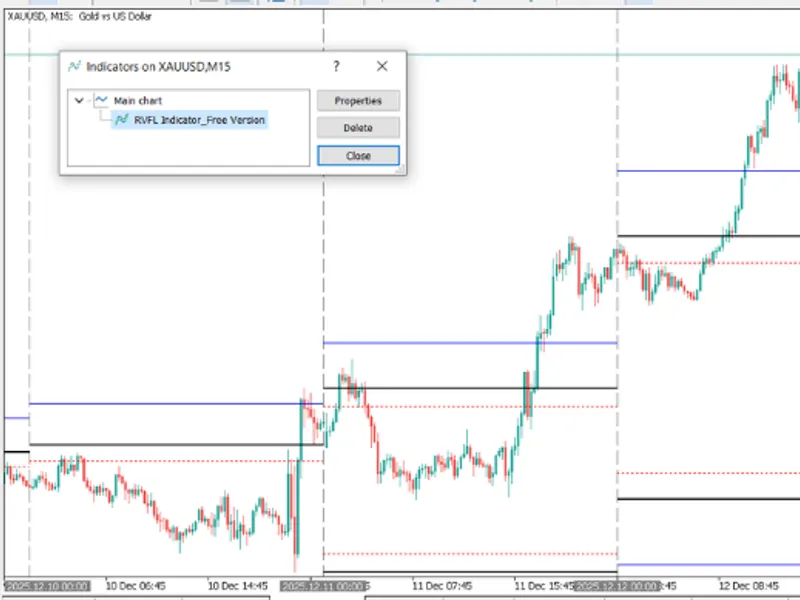
The indicator draws specific lines to guide your trading decisions:
Black Lines (Entry): These mark the Breakout trigger levels (Yesterday's High and Low). A candle closes outside these lines signals a potential entry.
Red Dotted Lines (Stop Loss): Placed at the 0.9 Fibonacci retracement level. If price reverses to this level, the setup is invalid.
Blue Solid Lines (Take Profit): Placed at the 1.25 Fibonacci expansion level. This is the statistical exhaustion point for the day's volatility vector.
Recommended Symbol and Timeframe
Symbol: XAUUSD (Gold)
Timeframe: M15 (15-Minute)
External Variables (Parameters)
This indicator allows full customization of the strategy logic and visuals:
History_Days: Determines how many past days the indicator will draw levels for (Default: 10).
Show_Period_Sep: Toggle vertical separators to visually divide trading days (true/false).
Line_Width: Adjust the thickness of the signal lines for better visibility (Default: 2).
Entry / Stop Loss / Take Profit Color: Customize the line colors to match your chart background.
Long_SL_Level: The Fibonacci ratio for Long Stop Loss (Default: 0.9).
Long_TP_Level: The Fibonacci ratio for Long Take Profit (Default: 1.25).
Short_SL_Level: The Fibonacci ratio for Short Stop Loss (Default: 0.1).
Short_TP_Level: The Fibonacci ratio for Short Take Profit (Default: -0.25).