Boom Index Spike Pattern
This software component for MetaTrader 5 is built to enhance the capabilities of your trading environment. This technical indicator acts as a specialized analysis tool designed to visualize market data. It helps traders identify emerging trends, momentum shifts, and key support or resistance levels by plotting statistical calculations directly onto price charts.
How to Setup and Use Boom Index Spike Pattern
1. Installation: Place your file in the MQL/Indicators folder via "Open Data Folder" and restart your terminal.
2. Loading: Find the indicator in the Navigator, drag it onto your chart, and configure the input parameters in the popup window.
3. Customization: Press Ctrl+I to open the indicator list, select your tool, and click "Properties" to change colors, levels, or visual styles.
4. Updating: Replace the old file in the Indicators folder with the new version and restart the platform to apply changes.
Frequently Asked Questions
Q: Why is my indicator not showing? A: Verify the file is in the MQL/Indicators folder, or try right-clicking the "Indicators" tree in the Navigator and clicking "Refresh."
Q: Do custom indicators slow down the platform? A: Too many complex indicators can impact performance; remove unused ones via the "Indicator List" (Ctrl+I).
Q: Can I use MT4 indicators on MT5? A: No, MQL4 and MQL5 are distinct languages; ensure the indicator is compiled specifically for your platform version.
Description & Settings
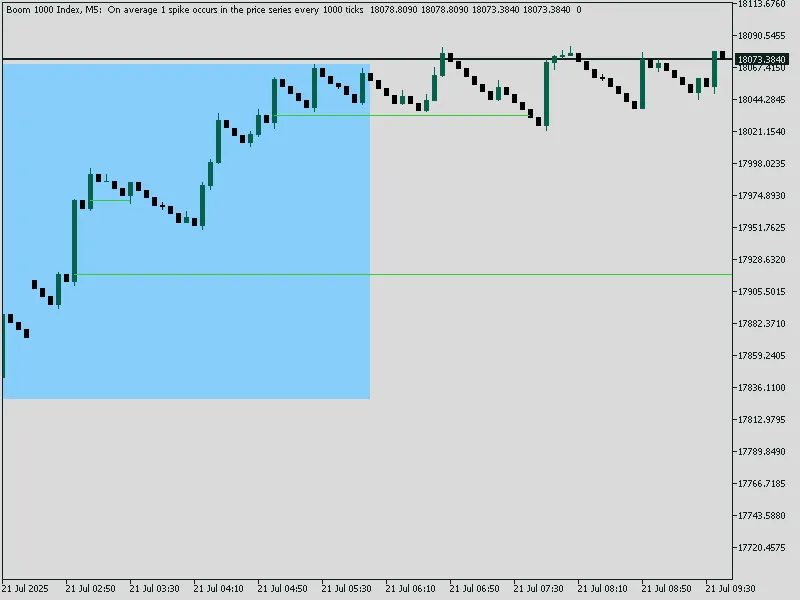
Bullish Spike Pattern Detection
3-bar pattern:
1st candle:
Green with large body (bullish spike).
2nd candle:
Red (pullback).
3rd candle:
Green with large body (bullish spike).
When this pattern appears, a
zone is created
.
Zone Creation
A
blue rectangle
is drawn from the high/low range of the 3 candles.
A
lime green horizontal entry line
is drawn at the open price of the middle (2nd) candle.
The line extends far into the future until price comes back.
INPUTS EXPLAINED
CORE IDEA
We look for a 3-candle bullish pattern
1. First candle– strong bullish (spike)
2. Second candle – bearish retracement
3. Third candle– strong bullish spike again
When this appears, we draw:
- A box around the pattern
- A horizontal line at the 2nd candle’s open (entry point
Once price returns to that line ("mitigation"), we cut the line short and avoid redrawing it.
DATA STRUCTURES ON INIT FUNCTION PATTERN DETECTION (ON EACH TICK) DRAW BOX AND LINE MITIGATION CHECK (ON EACH TICK)
This indicator is simple yet powerful:
Detects real spike behavior in Boom
Visualizes smart money entries
Automatically detects mitigation
You can now test it live on Boom 500 or Boom 1000.
thanks comment if you want to ask or share .