Bid-Ask Pressure Dashboard
This professional-grade solution for MetaTrader 5 helps traders achieve greater efficiency in their daily workflow. This technical indicator acts as a specialized analysis tool designed to visualize market data. It helps traders identify emerging trends, momentum shifts, and key support or resistance levels by plotting statistical calculations directly onto price charts.
How to Setup and Use Bid-Ask Pressure Dashboard
1. Installation: Place your file in the MQL/Indicators folder via "Open Data Folder" and restart your terminal.
2. Loading: Find the indicator in the Navigator, drag it onto your chart, and configure the input parameters in the popup window.
3. Customization: Press Ctrl+I to open the indicator list, select your tool, and click "Properties" to change colors, levels, or visual styles.
4. Updating: Replace the old file in the Indicators folder with the new version and restart the platform to apply changes.
Frequently Asked Questions
Q: Why is my indicator not showing? A: Verify the file is in the MQL/Indicators folder, or try right-clicking the "Indicators" tree in the Navigator and clicking "Refresh."
Q: Do custom indicators slow down the platform? A: Too many complex indicators can impact performance; remove unused ones via the "Indicator List" (Ctrl+I).
Q: Can I use MT4 indicators on MT5? A: No, MQL4 and MQL5 are distinct languages; ensure the indicator is compiled specifically for your platform version.
Description & Settings
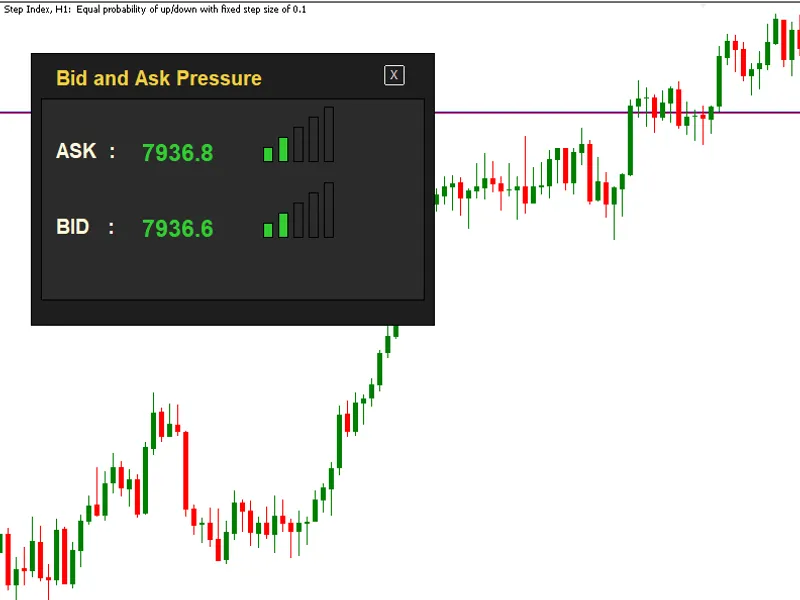
Bid-Ask Profile Dashboard for MT5
This tool demonstrates how to build a real-time microstructure visualization panel directly on a MetaTrader 5 chart using the standard GUI framework. The project implements a custom Bid-Ask monitoring dashboard that tracks consecutive tick price changes from incoming ticks and converts them into a simple yet informative market pressure histogram. A lightweight structure stores recent price updates and evaluates directional movement to estimate short-term buying or selling pressure. Key Features
Fully custom GUI dashboard built with chart objects
Real-time Bid and Ask price monitoring
Consecutive price trend analysis with trend-strength decay
Dynamic histogram bars representing market pressure
Color-coded direction detection (buy vs sell pressure)
Interactive close button for quick indicator removal
Efficient tick-driven updates
Developer Insights The source code also demonstrates practical techniques for:
Building custom trading dashboards in MQL5
Managing lightweight price buffers
Implementing directional trend-strength logic with decay handling
Creating reusable GUI helper functions
Updating interface components efficiently in real time This project is well suited for developers interested in tick-level market analysis, trading dashboards, and custom interface development in MQL5.