Awesome Oscillator Divergence
This is a powerful addition to your MetaTrader 5 toolkit designed to optimize market analysis and performance. This technical indicator acts as a specialized analysis tool designed to visualize market data. It helps traders identify emerging trends, momentum shifts, and key support or resistance levels by plotting statistical calculations directly onto price charts.
How to Setup and Use Awesome Oscillator Divergence
1. Installation: Place your file in the MQL/Indicators folder via "Open Data Folder" and restart your terminal.
2. Loading: Find the indicator in the Navigator, drag it onto your chart, and configure the input parameters in the popup window.
3. Customization: Press Ctrl+I to open the indicator list, select your tool, and click "Properties" to change colors, levels, or visual styles.
4. Updating: Replace the old file in the Indicators folder with the new version and restart the platform to apply changes.
Frequently Asked Questions
Q: Why is my indicator not showing? A: Verify the file is in the MQL/Indicators folder, or try right-clicking the "Indicators" tree in the Navigator and clicking "Refresh."
Q: Do custom indicators slow down the platform? A: Too many complex indicators can impact performance; remove unused ones via the "Indicator List" (Ctrl+I).
Q: Can I use MT4 indicators on MT5? A: No, MQL4 and MQL5 are distinct languages; ensure the indicator is compiled specifically for your platform version.
Description & Settings
This indicator will plot divergence lines on the Awesome_Oscillator indicator and will give buy and sell signal by displaying arrows.
Bullish Regular_Divergence is plotted in Blue lines & solid,
Bullish Hidden_Divergence is plotted in Aqua lines & dotted,
Bearish Regular_Divergence is plotted in Red lines & solid,
Bearish Hidden_Divergence is plotted in Orange lines & dotted,
& Indicator Divergence lines does not pass ( going across ) through the body of the Indicator/histogram.
This indicator based on description for divergence in:
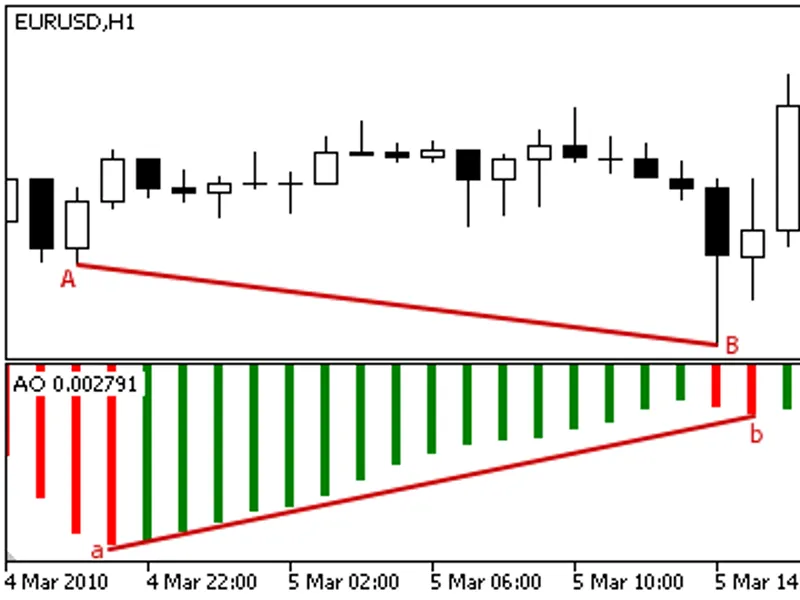
for example in Bullish Regular_Divergence:
Fig. 1. Bullish Divergence example
Divergence: the first analyzed bottom of the indicator is shallower than the previous one, and the corresponding price valley is deeper than the previous one. In addition,
the indicator must not rise above the zero level.
Parameters:
Inputs parameters are shown in below pic.
Fig. 2. Input parameters of the Awesome Oscillator Divergence indicator
Two of them are important.
1. Deviation_percent
: default value is 0.05 and this is the maximum percent ratio of AO value which allowed to be out of range.
As shown in Figure below:
Fig. 3. Awesome Oscillator percent ratio
Obviously, with choice 0.0 there are all AO value will be within the range.
2. Indicator_Trend_Line_Allowed_across_through_the_histogram_body:
default value is no.
The following screenshots are enough to show the difference in performance for different modes yes/no.
Fig. 4. Indicator_Trend_Line_Allowed_across_through_the_histogram_body=no
Fig. 5. Indicator_Trend_Line_Allowed_across_through_the_histogram_body=yes