Average True Range (AT R)
This professional-grade solution for MetaTrader 5 helps traders achieve greater efficiency in their daily workflow. This technical indicator acts as a specialized analysis tool designed to visualize market data. It helps traders identify emerging trends, momentum shifts, and key support or resistance levels by plotting statistical calculations directly onto price charts.
How to Setup and Use Average True Range (AT R)
1. Installation: Place your file in the MQL/Indicators folder via "Open Data Folder" and restart your terminal.
2. Loading: Find the indicator in the Navigator, drag it onto your chart, and configure the input parameters in the popup window.
3. Customization: Press Ctrl+I to open the indicator list, select your tool, and click "Properties" to change colors, levels, or visual styles.
4. Updating: Replace the old file in the Indicators folder with the new version and restart the platform to apply changes.
Frequently Asked Questions
Q: Why is my indicator not showing? A: Verify the file is in the MQL/Indicators folder, or try right-clicking the "Indicators" tree in the Navigator and clicking "Refresh."
Q: Do custom indicators slow down the platform? A: Too many complex indicators can impact performance; remove unused ones via the "Indicator List" (Ctrl+I).
Q: Can I use MT4 indicators on MT5? A: No, MQL4 and MQL5 are distinct languages; ensure the indicator is compiled specifically for your platform version.
Description & Settings
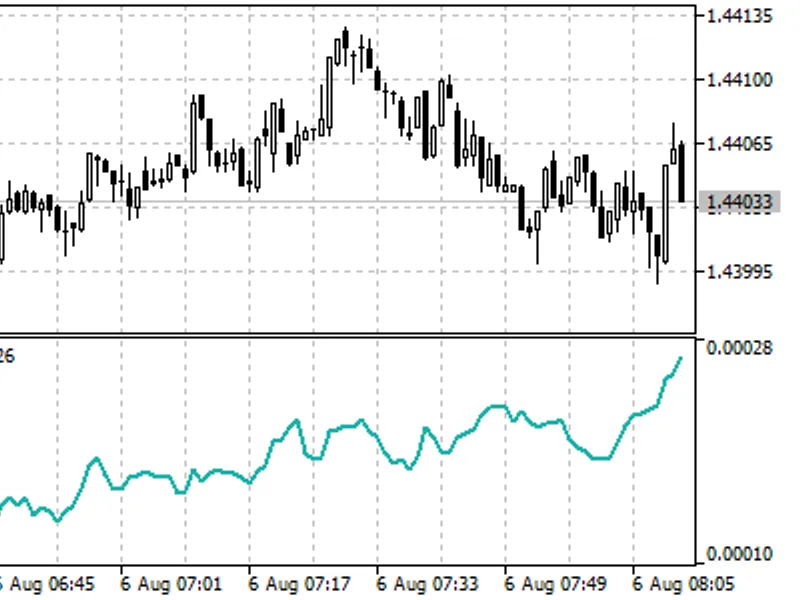
Average True Range (ATR) is a technical indicator that shows market volatility.
It was introduced by Welles Wilder in his book "New concepts in technical trading systems". This indicator has been used as a component of numerous other indicators and trading systems ever since.
Average True Range can often reach a high value at the bottom of the market after a sheer fall in prices occasioned by panic selling. Low values of the indicator are typical for the periods of sideways movement of long duration which happen at the top of the market and during consolidation.
Average True Range can be interpreted according to the same principles as other volatility indicators. The principle of forecasting based on this indicator can be worded the following way: the higher the value of the indicator, the higher the probability of a trend change; the lower the indicator’s value, the weaker the trend’s movement is.
Calculation:
True Range is the greatest of the following three values:
Difference between the current maximum and minimum (high and low);
Difference between the previous closing price and the current maximum;
Difference between the previous closing price and the current minimum.
The indicator of Average True Range is a moving average of values of the true range.