Average Directional Movement Index Wilder
This professional-grade solution for MetaTrader 5 helps traders achieve greater efficiency in their daily workflow. This technical indicator acts as a specialized analysis tool designed to visualize market data. It helps traders identify emerging trends, momentum shifts, and key support or resistance levels by plotting statistical calculations directly onto price charts.
How to Setup and Use Average Directional Movement Index Wilder
1. Installation: Place your file in the MQL/Indicators folder via "Open Data Folder" and restart your terminal.
2. Loading: Find the indicator in the Navigator, drag it onto your chart, and configure the input parameters in the popup window.
3. Customization: Press Ctrl+I to open the indicator list, select your tool, and click "Properties" to change colors, levels, or visual styles.
4. Updating: Replace the old file in the Indicators folder with the new version and restart the platform to apply changes.
Frequently Asked Questions
Q: Why is my indicator not showing? A: Verify the file is in the MQL/Indicators folder, or try right-clicking the "Indicators" tree in the Navigator and clicking "Refresh."
Q: Do custom indicators slow down the platform? A: Too many complex indicators can impact performance; remove unused ones via the "Indicator List" (Ctrl+I).
Q: Can I use MT4 indicators on MT5? A: No, MQL4 and MQL5 are distinct languages; ensure the indicator is compiled specifically for your platform version.
Description & Settings
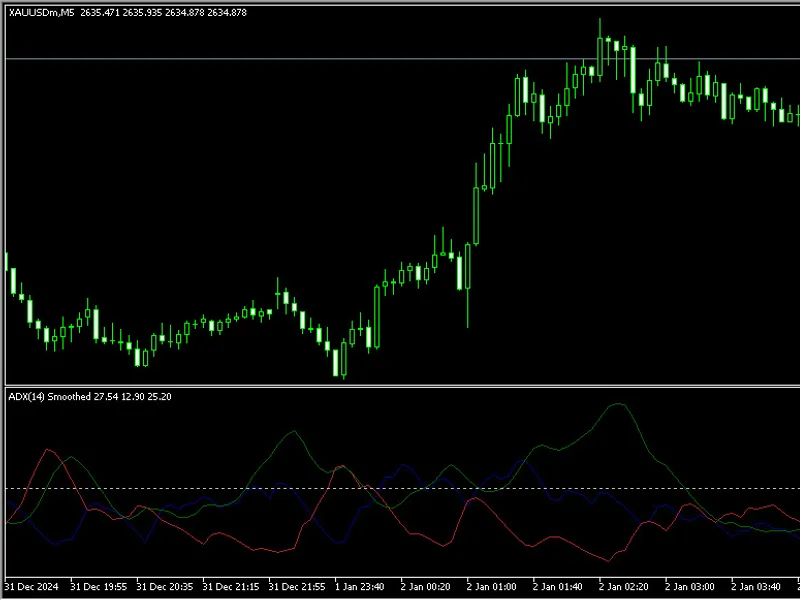
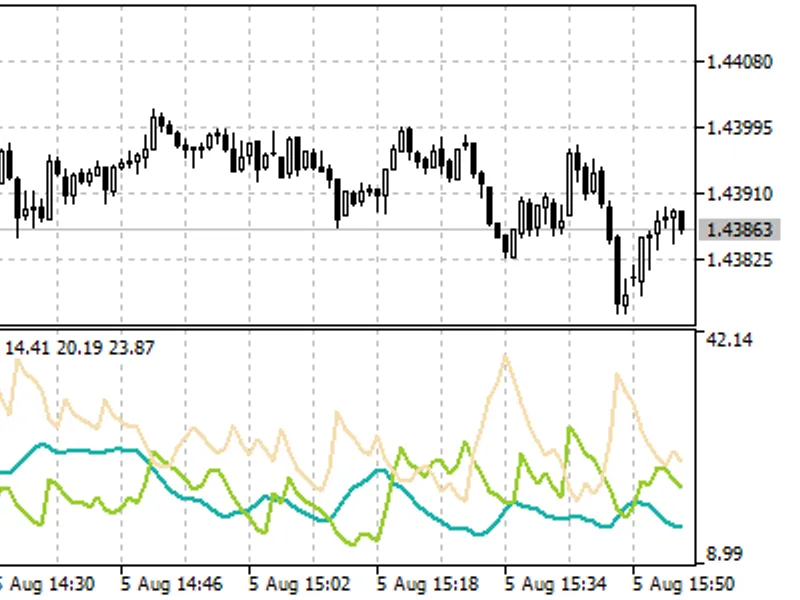
Average Directional Movement Index Wilder (ADX Wilder) helps to determine if there is a market trend.
This technical indicator is constructed as a strict correspondence with the algorithm described by Welles Wilder in his book "New concepts in technical trading systems".
Trading rules of this indicator are described in the Average Directional Movement Index.
Calculation:
First positive (dm_plus) and negative (dm_minus) changes at each bar are calculated, as well as the true range tr:
If High(i) - High(i-1) > 0 dm_plus(i) = High[(i) - High(i-1), otherwise dm_plus(i) = 0.
If Low(i-1) - Low(i) > 0 dm_minus(i) = Low(i-1) - Low(i), otherwise dm_minus(i) = 0.
tr(i) = Max(ABS(High(i) - Low(i)), ABS(High(i) - Close(i-1)), ABS(Low(i) - Close(i-1)))
where:
High(i) - maximum price of the current bar;
Low(i) - minimum price of the current bar;
High(i-1) - maximum price of the previous bar;
Low(i-1) - minimum price of the previous bar;
Close(i-1) - close price of the previous bar;
Max (a, b , c) - maximum value out of three numbers: a, b и c;
ABS(X) - absolute value of the X.
After that the smoothed values are calculated: Plus_D(i), Minus_D(i) and ATR():
ATR(i) = SMMA(tr, Period_ADX,i)Plus_D(i) = SMMA(dm_plus, Period_ADX,i)/ATR(i)*100Minus_D(i) = SMMA(dm_minus, Period_ADX,i)/ATR(i)*100
where:
SMMA(X, N, i) - Smoothed Moving Average of X series on the current bar;
Perod_ADX - number of bars, used for calculation.
Now Directional Movement Index - DX(i) - is calculated:
DX(i) = ABS(Plus_D(i) - Minus_D(i))/(Plus_D(i) + Minus_D(i)) * 100
After preliminary calculations we obtain the value of the ADX(i) indicator on the current bar by smoothing DX index values:
ADX(i) = SMMA(DX, Perod_ADX, i)