AT R ratio
This tool for MetaTrader 5 is specifically engineered to streamline your trading operations. This technical indicator acts as a specialized analysis tool designed to visualize market data. It helps traders identify emerging trends, momentum shifts, and key support or resistance levels by plotting statistical calculations directly onto price charts.
How to Setup and Use AT R ratio
1. Installation: Place your file in the MQL/Indicators folder via "Open Data Folder" and restart your terminal.
2. Loading: Find the indicator in the Navigator, drag it onto your chart, and configure the input parameters in the popup window.
3. Customization: Press Ctrl+I to open the indicator list, select your tool, and click "Properties" to change colors, levels, or visual styles.
4. Updating: Replace the old file in the Indicators folder with the new version and restart the platform to apply changes.
Frequently Asked Questions
Q: Why is my indicator not showing? A: Verify the file is in the MQL/Indicators folder, or try right-clicking the "Indicators" tree in the Navigator and clicking "Refresh."
Q: Do custom indicators slow down the platform? A: Too many complex indicators can impact performance; remove unused ones via the "Indicator List" (Ctrl+I).
Q: Can I use MT4 indicators on MT5? A: No, MQL4 and MQL5 are distinct languages; ensure the indicator is compiled specifically for your platform version.
Description & Settings
Luis Guilherme Damiani
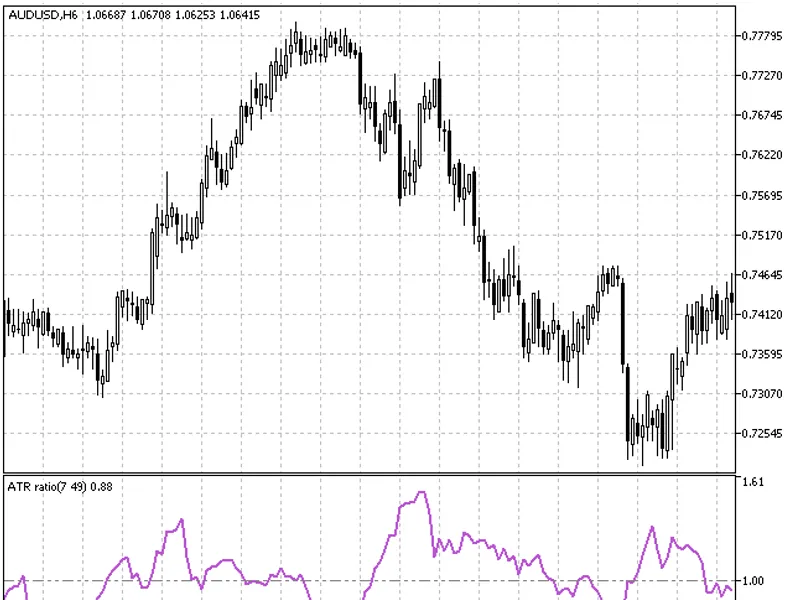
The indicator of the ratio between fast and slow ATR.
ATR ratio often reach high values after the prices quick and strong movements. Low indicator values often correspond with long periods of flat that can be observed on the market top and during consolidation. It can be intepreted according to same rules as other volatility indicators. Forecasting method using ATR ratio is as follows: the higher is the indicator value, the higher is the probability of a trend change; the lower is the value, the weaker is the trend movement. In case the indicator value climbs above the blue horizontal line, it is time to buy or sell.
High ATR ratio price levels often correlate with high volatility. Low ATR ratio price correlates with low volatility, as the prices stabilize or move along the channel flat movement up to the possible breakout point.
The indicator itself does not submit sufficient amount of signals and must be used together with other indicators. Volatility movements happen in the direction of a trend. Like systems, volatility systems for trend markets will not work well during a flat.
This indicator was first implemented in MQL4 and published in 08.08.2006.