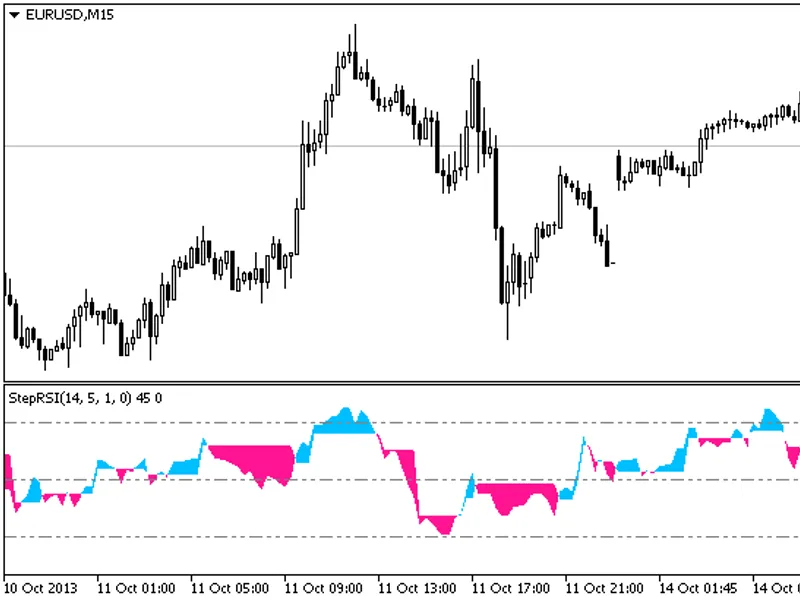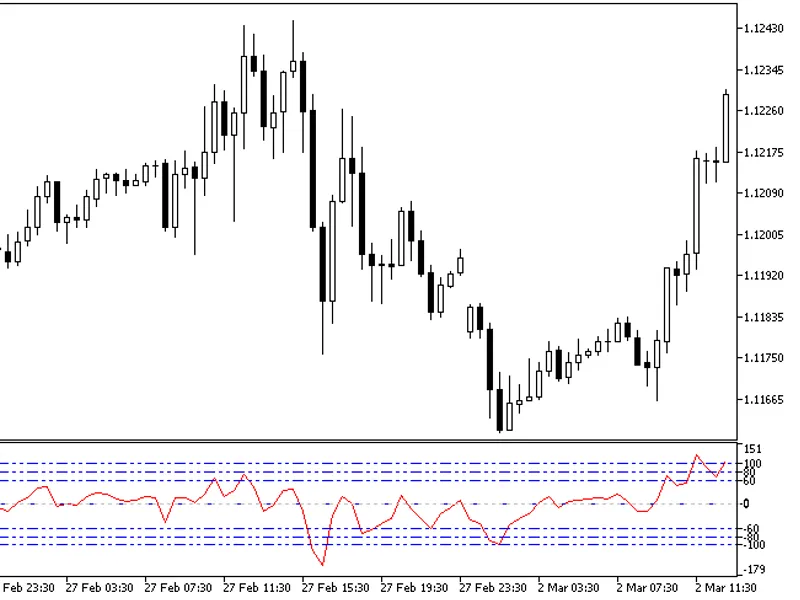
Shadow True Strength Index
This software component for MetaTrader 5 is built to enhance the capabilities of your trading environment. This technical indicator acts as a specialized analysis tool designed to visualize market data. It helps traders identify emerging trends, momentum shifts, and key support or resistance levels by plotting statistical calculations directly onto price charts.
How to Setup and Use Shadow True Strength Index
1. Installation: Place your file in the MQL/Indicators folder via "Open Data Folder" and restart your terminal.
2. Loading: Find the indicator in the Navigator, drag it onto your chart, and configure the input parameters in the popup window.
3. Customization: Press Ctrl+I to open the indicator list, select your tool, and click "Properties" to change colors, levels, or visual styles.
4. Updating: Replace the old file in the Indicators folder with the new version and restart the platform to apply changes.
Frequently Asked Questions
Q: Why is my indicator not showing? A: Verify the file is in the MQL/Indicators folder, or try right-clicking the "Indicators" tree in the Navigator and clicking "Refresh."
Q: Do custom indicators slow down the platform? A: Too many complex indicators can impact performance; remove unused ones via the "Indicator List" (Ctrl+I).
Q: Can I use MT4 indicators on MT5? A: No, MQL4 and MQL5 are distinct languages; ensure the indicator is compiled specifically for your platform version.
Description & Settings
Shadow True Strength Index oscillator with two signal lines (TSI shadows).
It has ten adjustable parameters:
Price source
- calculation price of the source data, on which TSI (*) is calculated
Price source period
- calculation period of the source data, on which TSI (*) is calculated
First smoothing period
- primary smoothing period
Second smoothing period
- secondary smoothing period
First shadow period
- first signal line calculation period
First shadow method
- first signal line calculation method
Second shadow period
- second signal line calculation period
Second shadow method
- second signal line calculation method
Overbought
- overbought level
Oversold
- oversold level
Calculations:
TSI = 100.0 * UDM2 / ADM2Shadow1 = MA(TSI, First shadow period, First shadow method)Shadow2 = MA(Shadow1, Second shadow period, Second shadow method)
where:
UDM2 = EMA(UDM1, Second smoothing period)ADM2 = EMA(ADM1, Second smoothing period)
UDM1 = EMA(UDM, First smoothing period)ADM1 = EMA(ADM, First smoothing period)
UDM = Close - PrevCloseADM = ABS(UDM)
*
Source data for TSI calculation:
unlike indicator calculated on the Close price, the calculations here are based on prices of the simple moving average (SMA) featuring both calculation prices and a timeframe. If SMA's Price source period is 1, the TSI line of the indicator fully coincides with the line of indicator . In case of the high values of the Price source period, the TSI line is smoothed.