Asymmetric Stoch NR
This tool for MetaTrader 5 is specifically engineered to streamline your trading operations. This technical indicator acts as a specialized analysis tool designed to visualize market data. It helps traders identify emerging trends, momentum shifts, and key support or resistance levels by plotting statistical calculations directly onto price charts.
How to Setup and Use Asymmetric Stoch NR
1. Installation: Place your file in the MQL/Indicators folder via "Open Data Folder" and restart your terminal.
2. Loading: Find the indicator in the Navigator, drag it onto your chart, and configure the input parameters in the popup window.
3. Customization: Press Ctrl+I to open the indicator list, select your tool, and click "Properties" to change colors, levels, or visual styles.
4. Updating: Replace the old file in the Indicators folder with the new version and restart the platform to apply changes.
Frequently Asked Questions
Q: Why is my indicator not showing? A: Verify the file is in the MQL/Indicators folder, or try right-clicking the "Indicators" tree in the Navigator and clicking "Refresh."
Q: Do custom indicators slow down the platform? A: Too many complex indicators can impact performance; remove unused ones via the "Indicator List" (Ctrl+I).
Q: Can I use MT4 indicators on MT5? A: No, MQL4 and MQL5 are distinct languages; ensure the indicator is compiled specifically for your platform version.
Description & Settings
Svinozavr
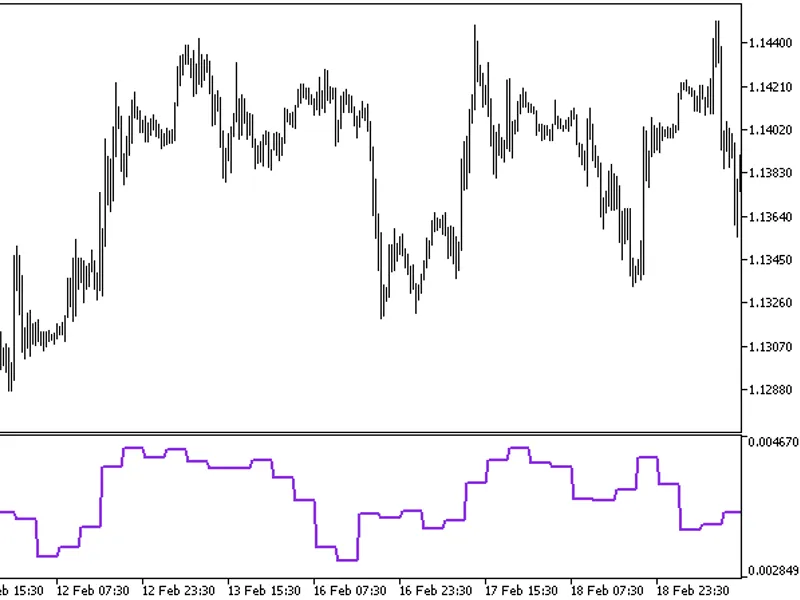
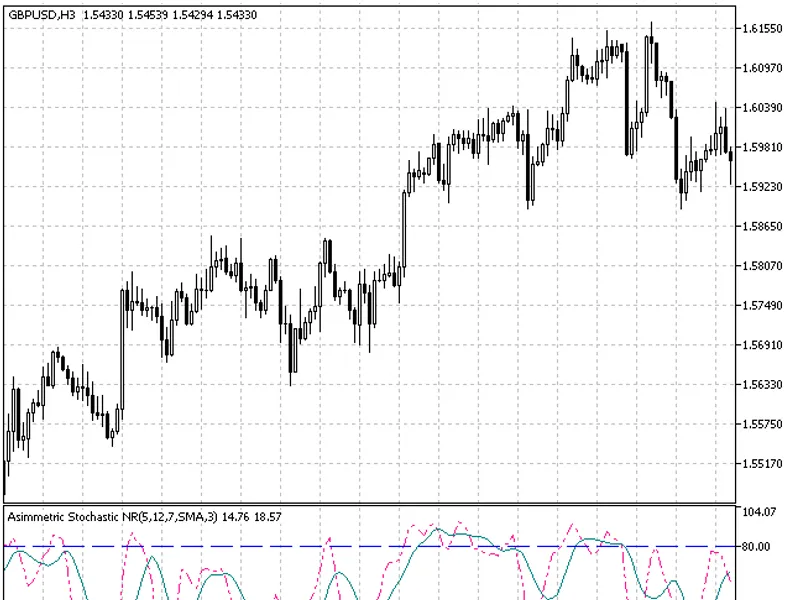
Kperiod now consists of two values - junior KperiodShort (short) and senior KperiodLong (long).
Oversold (OS) and overbought (OB) levels parameters are added. In case Stochastic enters OS/OB areas, Kperiods (lengths of highs/lows searching) are switched over.
The third difference (sensitivity limit) is a Sens parameter, which allows to cut off scillations below a certain limit set in points. Thereby, the number of false signals is considerably reduced. The fact is that the standard Stochastic locates the current price between price highs and lows for the number of bars set by %K (Kperiod) parameter. And it does not matter, if extreme points differ from each other by 1 or 100 points. It will still indicate that OS/OB values are reached. Implementation of some limit allows to cut off oscillations that are inconsiderable for a trading system.
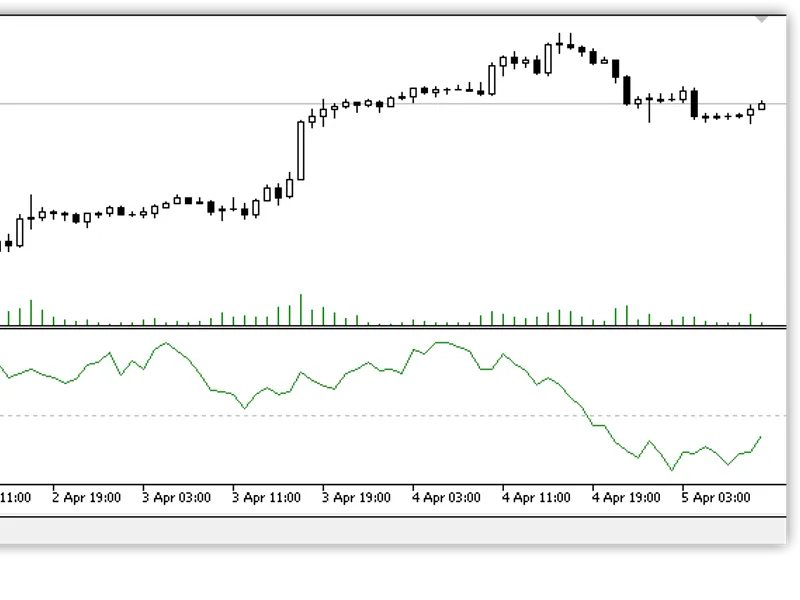
Behavior:
In case Stochastic enters OS area, the indicator searches for lows at the bars junior Kperiod (KperiodShort) and for highs - at the senior (KperiodLong) one. In case Stochastic enters OB area, lows are searched for at the long interval, while highs - at the short one.
Interpretation/usage.
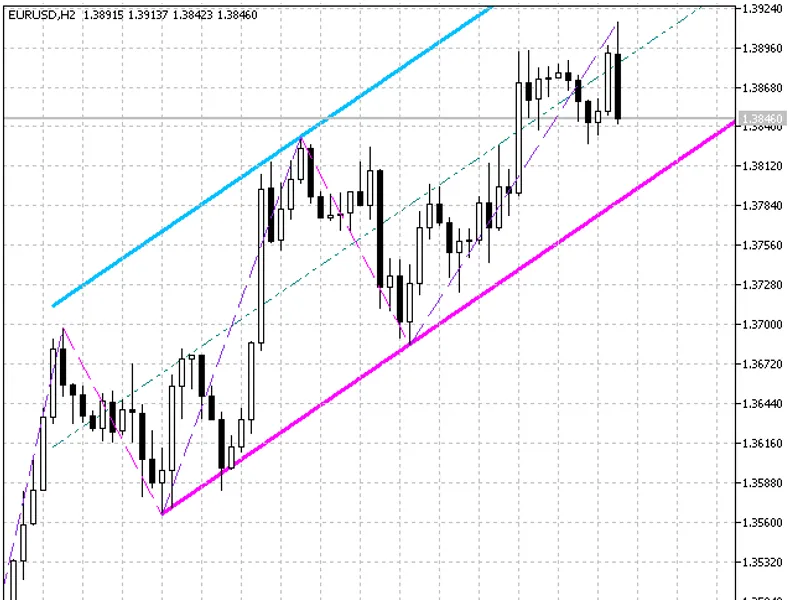
Entering OS/OB by Stochastic means switching a trend over to the appropriate direction. However, trend switching generally does NOT mean a signal for market entry according to the current trend direction. Position should be opened during a correction, which can be identified by 50% line crossing/touching. If you follow the "turtle" strategy, additions to your position should be made during corrections. When a trend is being switched over, positions should be closed completely or decreased. In the latter case complete closing of a position is carried out during the correction, while a new position in the opposite direction is opened simultaneously. Stop levels are set near the previous (opposite) extreme point with a reasonable setback. But their triggering in the operating mode is unlikely. Stop levels are set there only for force majeure conditions.
This indicator was first implemented in MQL4 and published in 22.04.2010.
Indicator input parameters:
- simple moving average;
- exponential moving average;
- smoothed moving average;
- linear weighted moving average;
- JMA adaptive average;
- ultralinear smoothing;
- parabolic smoothing;
- Tillson's multiple exponential smoothing;
- smoothing with the use of Tushar Chande's algorithm;
- smoothing with the use of Perry Kaufman's algorithm.
It should be noted that Phase type parameters for different smoothing algorithms have completely different meaning. For JMA it is an external Phase variable changing from -100 to +100. For T3 it is a smoothing ratio multiplied by 100 for better visualization, for VIDYA it is a CMO oscillator period and for AMA it is a slow EMA period. In other algorithms these parameters do not affect smoothing. For AMA fast EMA period is a fixed value and is equal to 2 by default. The ratio of raising to the power is also equal to 2 for AMA.
The indicator uses SmoothAlgorithms.mqh library classes (must be copied to the terminal_data_folder\MQL5\Include). The use of the classes was thoroughly described in the article .