Keltner Channel MT5
This is a powerful addition to your MetaTrader 5 toolkit designed to optimize market analysis and performance. This technical indicator acts as a specialized analysis tool designed to visualize market data. It helps traders identify emerging trends, momentum shifts, and key support or resistance levels by plotting statistical calculations directly onto price charts.
How to Setup and Use Keltner Channel MT5
1. Installation: Place your file in the MQL/Indicators folder via "Open Data Folder" and restart your terminal.
2. Loading: Find the indicator in the Navigator, drag it onto your chart, and configure the input parameters in the popup window.
3. Customization: Press Ctrl+I to open the indicator list, select your tool, and click "Properties" to change colors, levels, or visual styles.
4. Updating: Replace the old file in the Indicators folder with the new version and restart the platform to apply changes.
Frequently Asked Questions
Q: Why is my indicator not showing? A: Verify the file is in the MQL/Indicators folder, or try right-clicking the "Indicators" tree in the Navigator and clicking "Refresh."
Q: Do custom indicators slow down the platform? A: Too many complex indicators can impact performance; remove unused ones via the "Indicator List" (Ctrl+I).
Q: Can I use MT4 indicators on MT5? A: No, MQL4 and MQL5 are distinct languages; ensure the indicator is compiled specifically for your platform version.
Description & Settings
MA_Period
(default = 10) — the period of the moving average (middle line).
Mode_MA
(default = MODE_SMA) — the mode of the moving average (middle line).
Price_Type
(default = PRICE_TYPICAL) — the applied price of the moving average (middle line). Example and strategy
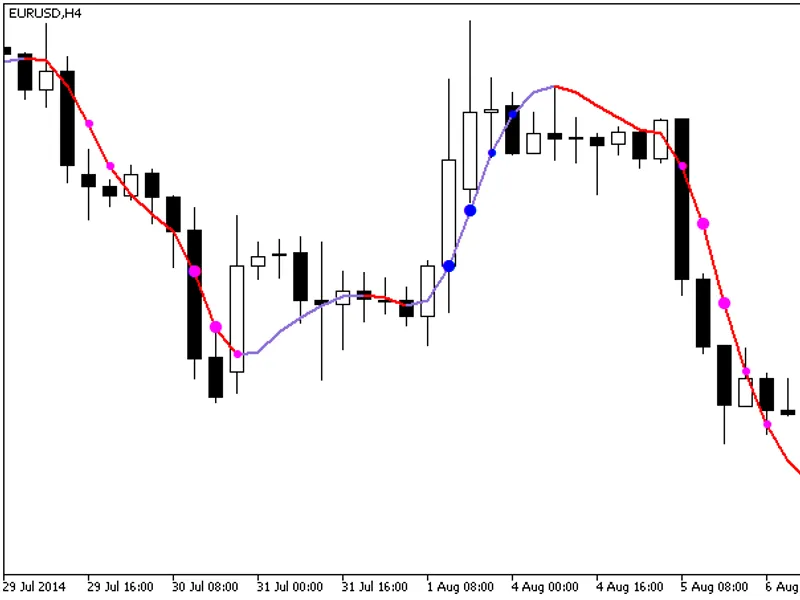
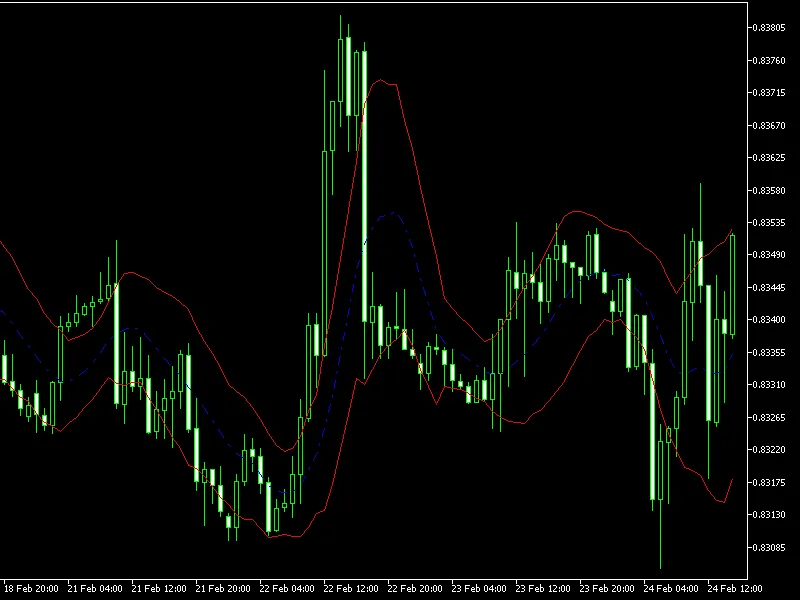
The classical strategy with this indicator is to go long when the price closes above the upper band and to go short when it closes below the lower band. It seems to be a rather viable entry system. The exits can be based on three components: a very conservative stop-loss (as you see on the chart, false signals are not uncommon), some rather distant take-profit, and a cross with the middle line. Some traders also suggest using other indicators for confirmation.
Mathematically, the channel represents the bands weighted more heavily towards the upper side during uptrends and towards the lower side during the downtrends. This means that the upper line is less likely to be broken in an already established rising trend. The vice versa is true for an already established downtrend.