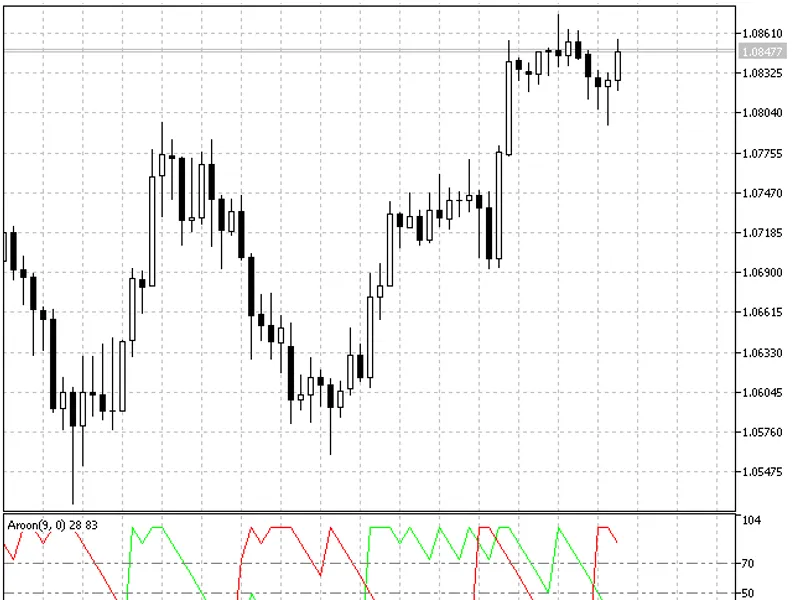
Aroon
This is a powerful addition to your MetaTrader 5 toolkit designed to optimize market analysis and performance. This technical indicator acts as a specialized analysis tool designed to visualize market data. It helps traders identify emerging trends, momentum shifts, and key support or resistance levels by plotting statistical calculations directly onto price charts.
How to Setup and Use Aroon
1. Installation: Place your file in the MQL/Indicators folder via "Open Data Folder" and restart your terminal.
2. Loading: Find the indicator in the Navigator, drag it onto your chart, and configure the input parameters in the popup window.
3. Customization: Press Ctrl+I to open the indicator list, select your tool, and click "Properties" to change colors, levels, or visual styles.
4. Updating: Replace the old file in the Indicators folder with the new version and restart the platform to apply changes.
Frequently Asked Questions
Q: Why is my indicator not showing? A: Verify the file is in the MQL/Indicators folder, or try right-clicking the "Indicators" tree in the Navigator and clicking "Refresh."
Q: Do custom indicators slow down the platform? A: Too many complex indicators can impact performance; remove unused ones via the "Indicator List" (Ctrl+I).
Q: Can I use MT4 indicators on MT5? A: No, MQL4 and MQL5 are distinct languages; ensure the indicator is compiled specifically for your platform version.
Description & Settings
Tushar Chande
Its main advantage is to allow a trader to determine the beginning of a new trend, or the end of an existing trend.
Aroon indicator can be calculated using the following equations:
Both equations indicate recent maximums and minimums. Higher indicator values show more recent maximums and minimums, whereas lower values show less recent maximums and minimums. Besides, Aroon indicator values oscillate between levels 0 and 100 where a higher value indicates a stronger trend and vice versa.
Indicator moves around 30 and 70 key positions - movements higher than 70 indicate a strong trend, whereas movements lower than 30 indicate a weak trend.
Movements between 30 and 70 indicate that the market is unstable. For example, if the bullish indicator is higher than level 70, whereas the bearish indicator is lower than level 30, the trend is definitely upward. Intersections between bullish and bearish indicators indicate confirmations, if they occur between the levels 30 and 70. For example, if the bullish indicator intersects the bearish one upwards, a upward trend is confirmed.