Actual Volatility Scanner
This is a powerful addition to your MetaTrader 4 toolkit designed to optimize market analysis and performance. This technical indicator acts as a specialized analysis tool designed to visualize market data. It helps traders identify emerging trends, momentum shifts, and key support or resistance levels by plotting statistical calculations directly onto price charts.
How to Setup and Use Actual Volatility Scanner
1. Installation: Place your file in the MQL/Indicators folder via "Open Data Folder" and restart your terminal.
2. Loading: Find the indicator in the Navigator, drag it onto your chart, and configure the input parameters in the popup window.
3. Customization: Press Ctrl+I to open the indicator list, select your tool, and click "Properties" to change colors, levels, or visual styles.
4. Updating: Replace the old file in the Indicators folder with the new version and restart the platform to apply changes.
Frequently Asked Questions
Q: Why is my indicator not showing? A: Verify the file is in the MQL/Indicators folder, or try right-clicking the "Indicators" tree in the Navigator and clicking "Refresh."
Q: Do custom indicators slow down the platform? A: Too many complex indicators can impact performance; remove unused ones via the "Indicator List" (Ctrl+I).
Q: Can I use MT4 indicators on MT5? A: No, MQL4 and MQL5 are distinct languages; ensure the indicator is compiled specifically for your platform version.
Description & Settings
Descritpion:
Volatility means oportunity. No price move means no profit (and no loss).
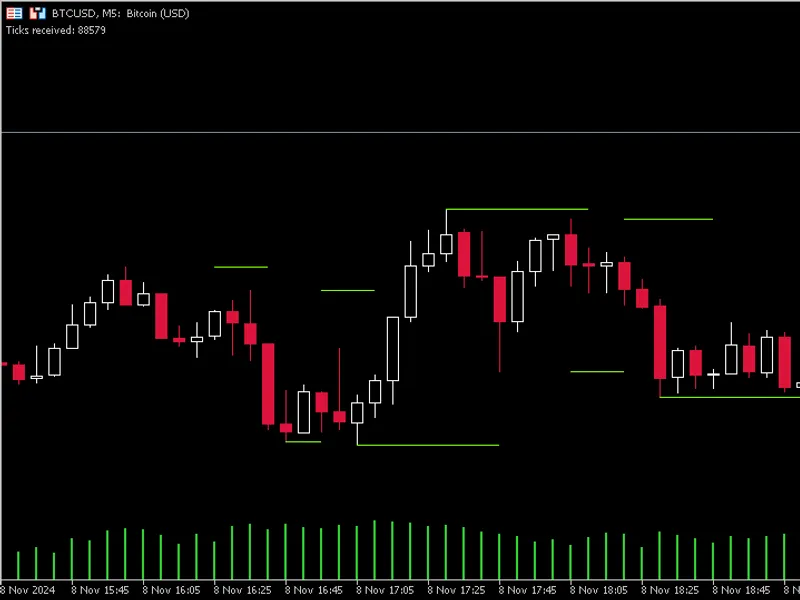
The indicator shows horizontal bars representing candle bodies with chosen index (
TrackedCandleIndex
).
The size of the candle body is shown in relative size to its average body (
CandleAverageNumber
).
The value of the realative size is shown next to the bar.
For instance:
On picture above CADCHF shows big volatility. Value 221% means that actual body is more than 2 times bigger than the CADCHF avreage body on actual time frame. On the contrary actual body size of pair GBPAUD is small. Body size is only 5% of its average body menas very low actual volatility on this pair.
In indicator window you can accommodate (change) following variables:
TextSize,
ReferenceBody … defines how long the bodies bars will be,
CandleAverageNumber,
TrackedCandleIndex
… zero (0) means actual candle, one (1) means candle by one step older and so on,
HorizontalStartPosition … defines how far from the right the indicator will be placed.
You can place more than one instance of the indicator in one chart and get broader picture of price map.
In case you place other instance of the indicator for other candle index you have to accommodate variable
HorizontalStartPosition
to avoid collision.
Usage:
Actual voliatility tracking: Low volatility can mean a contraction phase, than a bigger volatilty can come. Conversely if an extremely big candle preceded than it is less likely similarly big candle will follow.
Correlation: On the picture above you can see strong move of all 3 American indices one timframe back proving high correlation between these indices. Pairs with EUR on the contrary show very low volatility on actual time frame, pairs with CHF show strong move .