Absolute Strength Market
This professional-grade solution for MetaTrader 5 helps traders achieve greater efficiency in their daily workflow. This technical indicator acts as a specialized analysis tool designed to visualize market data. It helps traders identify emerging trends, momentum shifts, and key support or resistance levels by plotting statistical calculations directly onto price charts.
How to Setup and Use Absolute Strength Market
1. Installation: Place your file in the MQL/Indicators folder via "Open Data Folder" and restart your terminal.
2. Loading: Find the indicator in the Navigator, drag it onto your chart, and configure the input parameters in the popup window.
3. Customization: Press Ctrl+I to open the indicator list, select your tool, and click "Properties" to change colors, levels, or visual styles.
4. Updating: Replace the old file in the Indicators folder with the new version and restart the platform to apply changes.
Frequently Asked Questions
Q: Why is my indicator not showing? A: Verify the file is in the MQL/Indicators folder, or try right-clicking the "Indicators" tree in the Navigator and clicking "Refresh."
Q: Do custom indicators slow down the platform? A: Too many complex indicators can impact performance; remove unused ones via the "Indicator List" (Ctrl+I).
Q: Can I use MT4 indicators on MT5? A: No, MQL4 and MQL5 are distinct languages; ensure the indicator is compiled specifically for your platform version.
Description & Settings
Description:
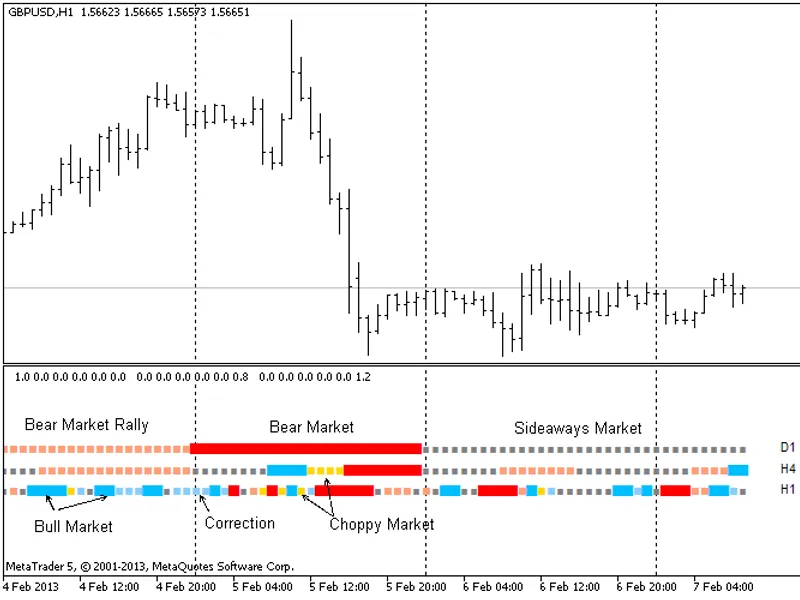
This indicator with a sufficient accuracy allows defining 6 market states, exactly:
Bull market (Bull Market).
Bear market (Bear Market).
Correction (Correction) in a bull market.
Correction in a bear market (Bear Market Rally).
Choppy market (Choppy Market).
Flat market (Sideways Market).
As in to define the market forces 3 methods of calculation are used: , and . Using Length, PreSmooth, Smooth, Signal and MA_Mode parameters you can achieve the desired accuracy of calculation. Keep in mind that a period of a signal line (Signal) starts from 1, in this case Bulls and Bears values on the previous bar are used.
The indicator also applies a set algorithm for calculation used on high timeframes. It allows putting several indicators in one subwindow for different timeframes as it has been displayed in the image.
If parameter AlertMode=1, then a monitor will display messages informing about changing market conditions.
Image: