Absolute Strength
This software component for MetaTrader 5 is built to enhance the capabilities of your trading environment. This technical indicator acts as a specialized analysis tool designed to visualize market data. It helps traders identify emerging trends, momentum shifts, and key support or resistance levels by plotting statistical calculations directly onto price charts.
How to Setup and Use Absolute Strength
1. Installation: Place your file in the MQL/Indicators folder via "Open Data Folder" and restart your terminal.
2. Loading: Find the indicator in the Navigator, drag it onto your chart, and configure the input parameters in the popup window.
3. Customization: Press Ctrl+I to open the indicator list, select your tool, and click "Properties" to change colors, levels, or visual styles.
4. Updating: Replace the old file in the Indicators folder with the new version and restart the platform to apply changes.
Frequently Asked Questions
Q: Why is my indicator not showing? A: Verify the file is in the MQL/Indicators folder, or try right-clicking the "Indicators" tree in the Navigator and clicking "Refresh."
Q: Do custom indicators slow down the platform? A: Too many complex indicators can impact performance; remove unused ones via the "Indicator List" (Ctrl+I).
Q: Can I use MT4 indicators on MT5? A: No, MQL4 and MQL5 are distinct languages; ensure the indicator is compiled specifically for your platform version.
Description & Settings
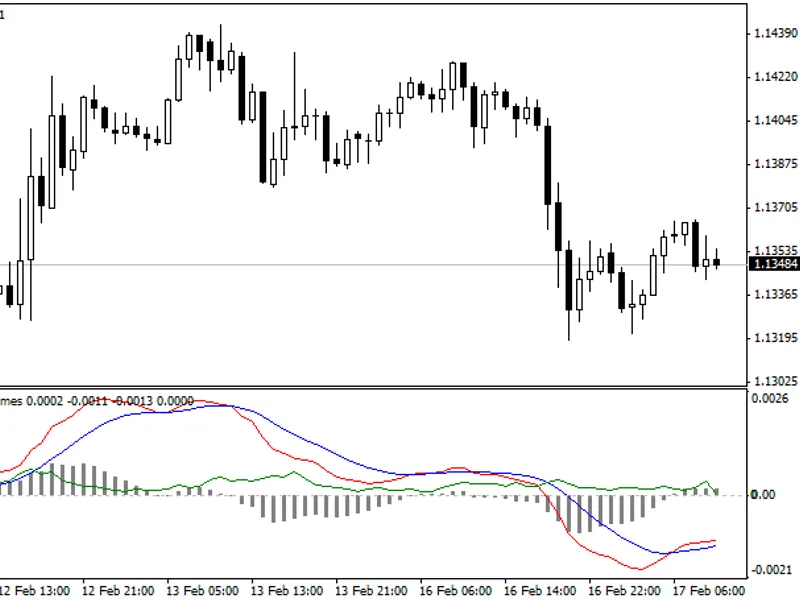
This indicator can be considered as an alternative to the well known , and , as far as their methods of calculation based on Buyers and Sellers strengths. Despite of the enumerated indicators, the calculation is performed in points, not in a percentage. It gives a possibility to appreciate finer-grained market strengths and avoid such sufficient disadvantages as slippage in the strong trend for Stochastic.
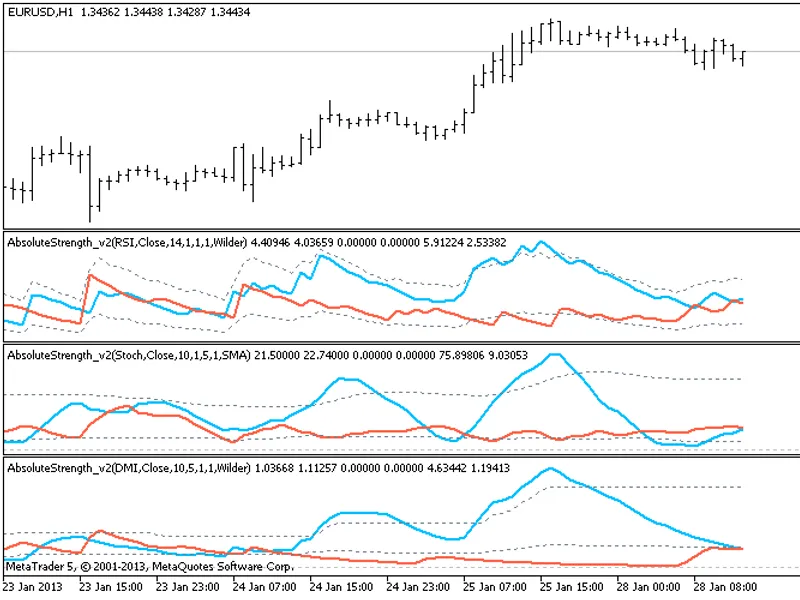
OverBought/OverSold levels (OverBought/OverSold),as in the RSI and Stochastic, regulated by StrengthLevel and Weakness Level parameters (for example, 70 and 30).
The channel of the standard deviations regulated by LookBackPeriod parameters and coefficients for the upper (UpperMultiplier) and lower (LowerMultiplier) bound of the channel.
High/Low Channel drawn on the principle of the price channel is regulated by the LookBackPeriod, StrengthLevel and Weakness Level parameters.
The illustration shows 3 variants of building the Strength and Weakness Levels. In the first subwindow are OverBought/OverSold levels, in the second is the channel of standard deviations and in the third is High/Low Channel.
The indicator has two additional smoothing using four type of the Moving Averages (MA_Mode: SMA, EMA, Wilder and LWMA):
preliminary smoothing of the prices with the PreSmooth parameter.
the main smoothing based on the calculated Bulls and Bears with the Smooth parameter.
To define the bend points of Bulls and Bears lines are used signal lines which are regulated by Signal and MA_Mode parameters. The indicator also uses a built-in algorithm of drawing lines for higher timeframes.