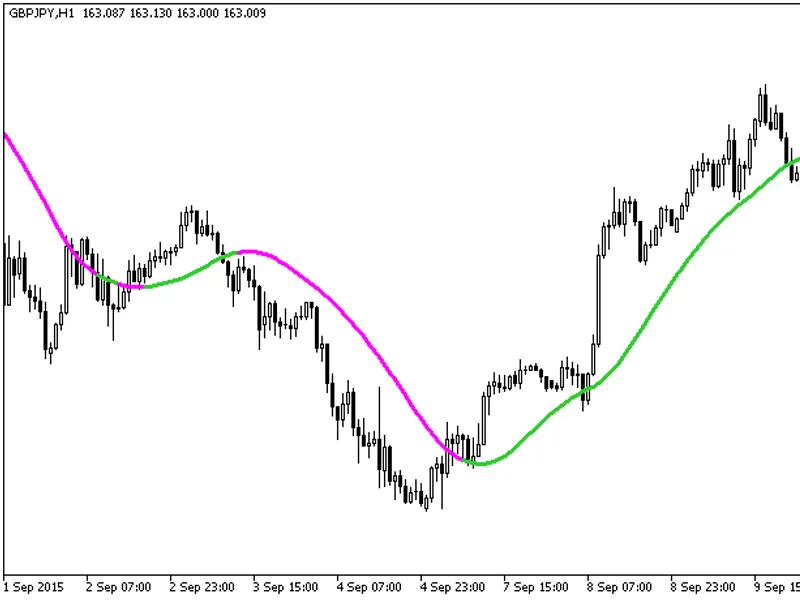
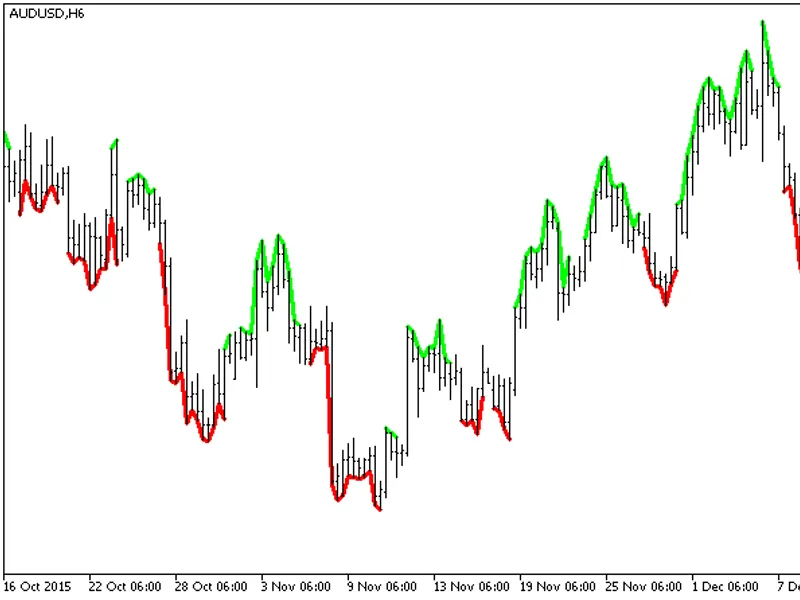
The RJ Tx Matches Smoothed indicator helps identify the start and end of trends using the slope and color of the "matches" lines.The slope of these lines indicates the evolution of...
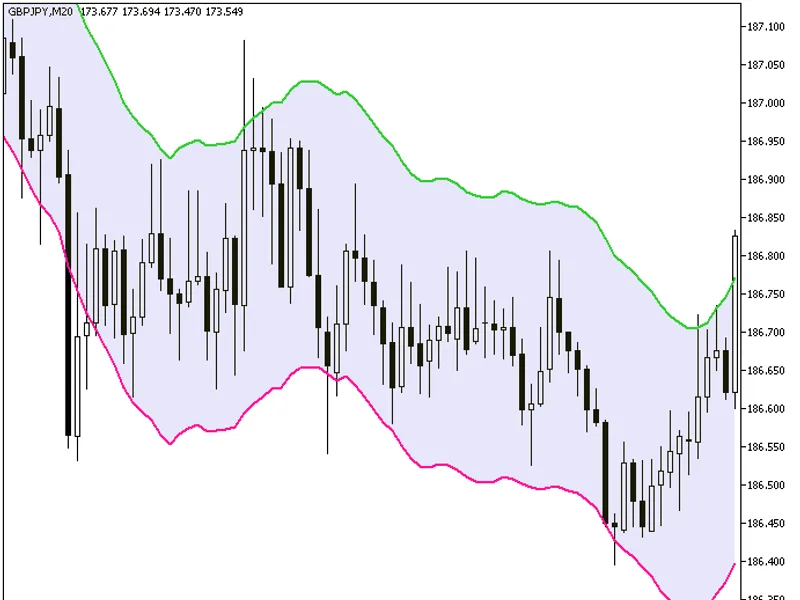
The Xenvelopes indicator is a classic tool that utilizes universal averaging algorithms to create and fill an envelope channel with a colored background.This indicator requires the...
The Xenvelopes HTF indicator includes a timeframe selection option within its input parameters.This indicator requires the xenvelopes.mq5 indicator file.Please place the xenvelopes...
The Xenvelopes2 indicator displays two envelopes channels derived from a single moving average with varying deviation values, visualized as a cloud.The first channel is rendered in...
X-Envelopes High Time Frame (HTF) Indicator with Timeframe Selection.This indicator includes a timeframe selection option within its input parameters.It requires the xenvelopes2 in...
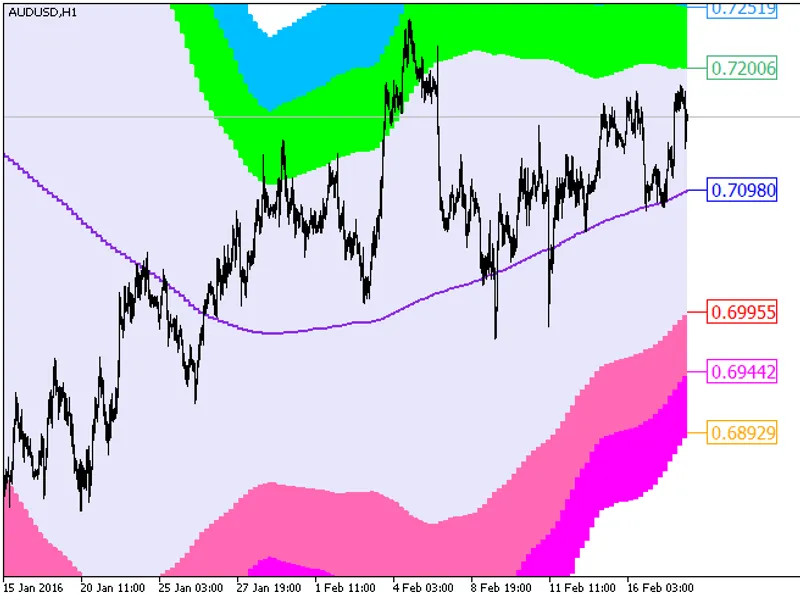
Three envelopes channels, based on one moving average with different deviation values, drawn as a cloud.The first channel is painted in a pale gray color.The top of the second chan...
The Xenvelopes3 HTF indicator includes a timeframe selection option within its input parameters.This indicator requires the xenvelopes3.mq5 indicator file to be present in the term...
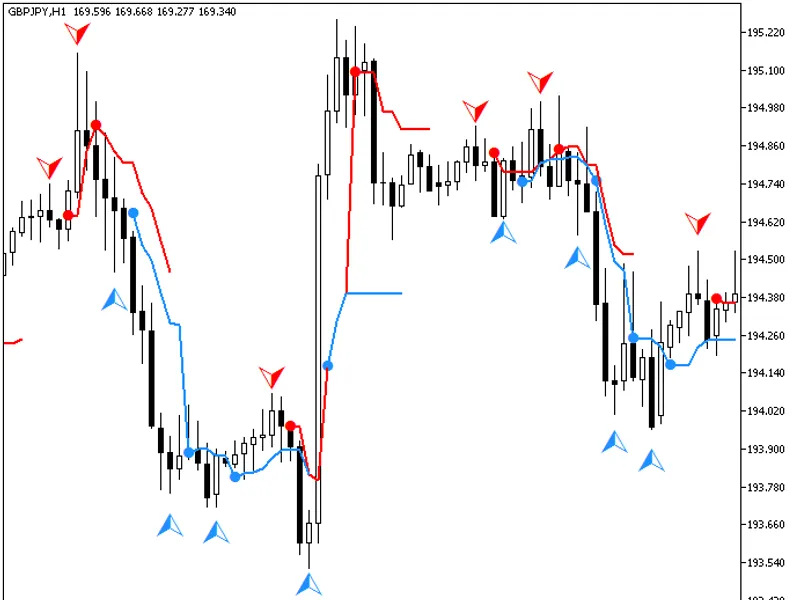
This indicator identifies entry points that align with reversal bars.Display:- Blue/red mark: Indicates a reversal has occurred.- Blue/red arrow: Represents a reversal bar.- Blue/r...
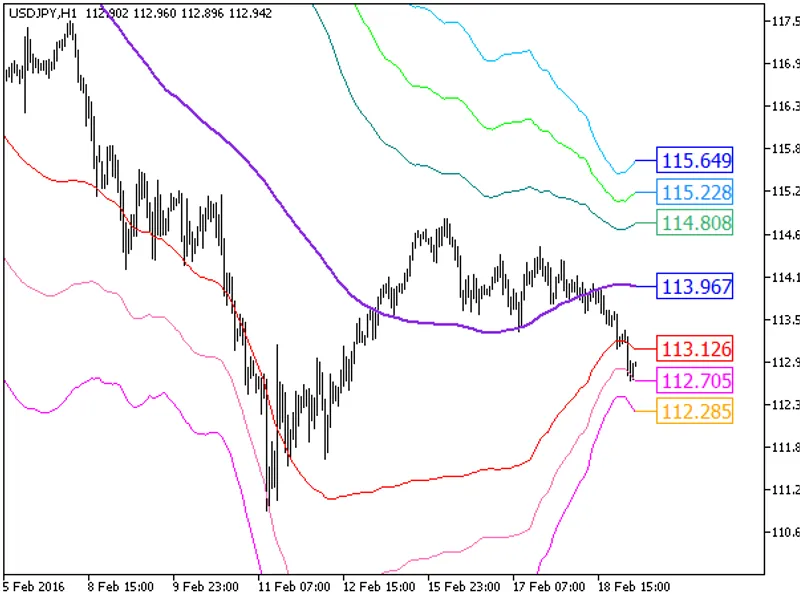
The Tango Line indicator visualizes rapid reversals in market direction, enabling early entry opportunities.Indicator Components:- Tango Line (Purple Line): Represents the midpoint...
The Tango Line HTF indicator includes a timeframe selection option in its input parameters.This indicator requires the tangoline.mq5 indicator file. Please place this file in the \...
Tango Line Cloud HTF Indicator with Timeframe SelectionThis indicator includes a timeframe selection option within its input parameters.The indicator requires the tangolinecloud.mq...
This indicator includes a timeframe selection option within its input parameters.To function, this indicator requires the colorxadx.mq5 indicator file. Please ensure this file is p...
Color MACD Histogram with Timeframe Selection.This indicator displays the MACD histogram and includes an option for timeframe selection within its input parameters.Prerequisites:Th...
Stochastic Oscillator with Noise Reduction and Higher Time Frame (HTF) selection option.This indicator requires the colorstochnr.mq5 indicator file. Please place this file in the \...
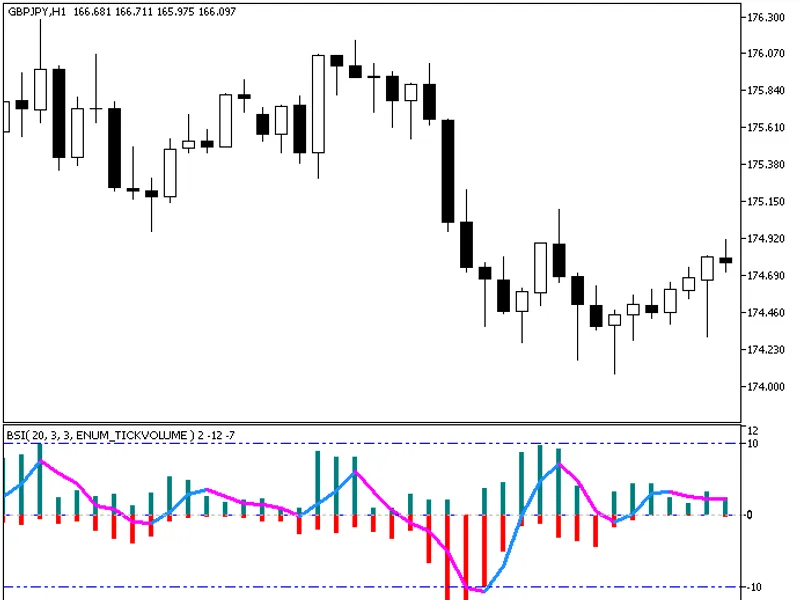
Bounce Strength Indicator (BSI) measures the strength of price bounces according to the Wyckoff method.Following an upward price movement, a stock may enter a period of flat consol...
This indicator includes a timeframe selection option within its input parameters.
It requires the bsi.mq5 indicator file, which should be placed in the \mql5\indicators directory.
...
Price Channel Central IndicatorThis indicator defines a price channel based on the highest and lowest bar values within a specified lookback period.The upper band of the channel re...
Price Channel Central High Time Frame (HTF) IndicatorThis indicator provides the functionality to select a higher timeframe within its input parameters.Prerequisites:The indicator ...
Bollinger Bands channel indicator with last price values displayed as labels.The indicator utilizes the smoothalgorithms.mqh library classes. Ensure this library is placed in the \...
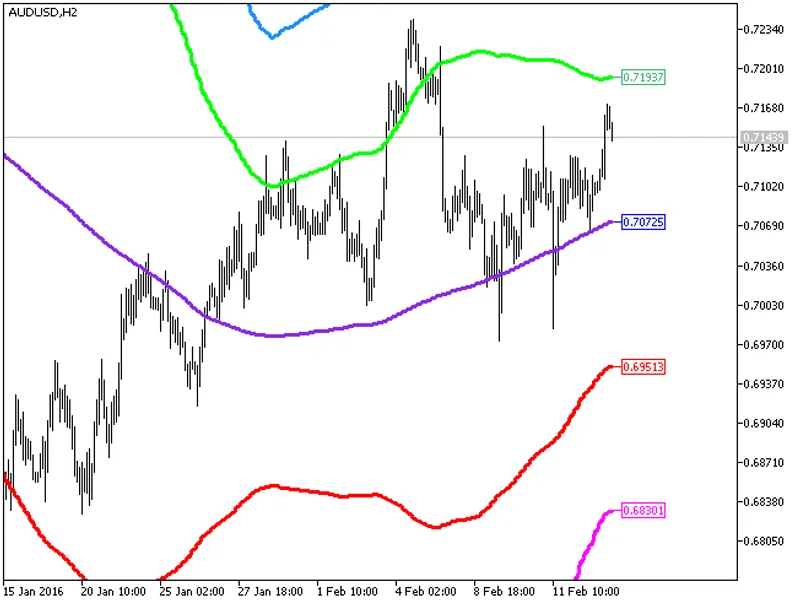
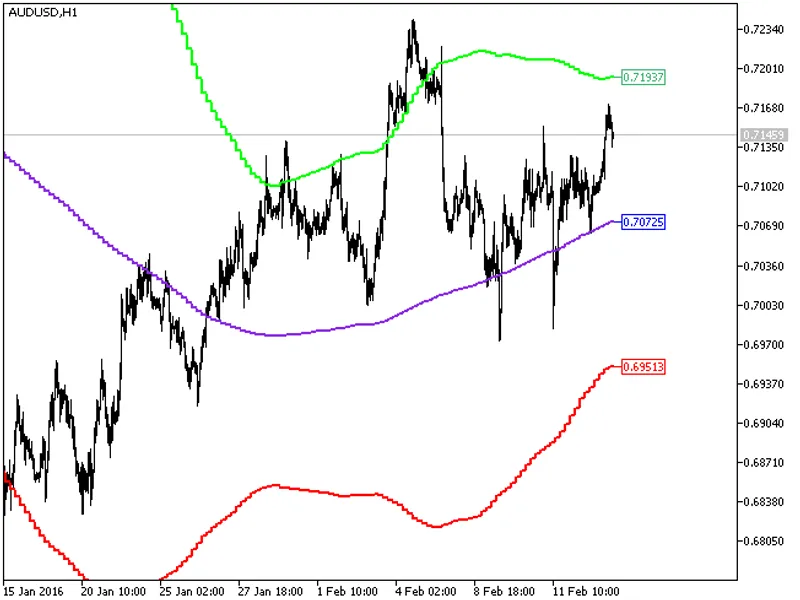
Two Bollinger Bands channels based on a single moving average, featuring the display of last values as price labels.
This indicator utilizes the smoothalgorithms.mqh library classe...
This indicator displays two Bollinger Bands channels based on a single moving average, presented as a colored cloud. It also shows the last values as price labels.The indicator uti...
This indicator is a modification of the original MACD.mq5 found in the MetaTrader 5 examples folder.
It displays the MACD main and signal lines and also includes the MACD histogram...
This indicator includes a timeframe selection option in its input parameters.The indicator requires the xma_bbx5_cloud.mq5 indicator file. Please place this file in your \mql5\indi...
The XMA BBX5 HTF Indicator provides timeframe selection directly within its input parameters.This indicator requires the xma_bbx5.mq5 indicator file.Please ensure this file is plac...
The XMA BBx3 HTF Indicator offers a timeframe selection option within its input parameters.This indicator requires the xma_bbx3.mq5 indicator file to function correctly. Please ens...
A trend indicator presented as a moving average that dynamically changes color based on trend direction.The trend direction is identified by comparing the relative positions of two...
Forex Line Sign Indicator
A semaphore signal indicator that generates trade signals based on trend direction changes. The trend direction is determined using the relative position...
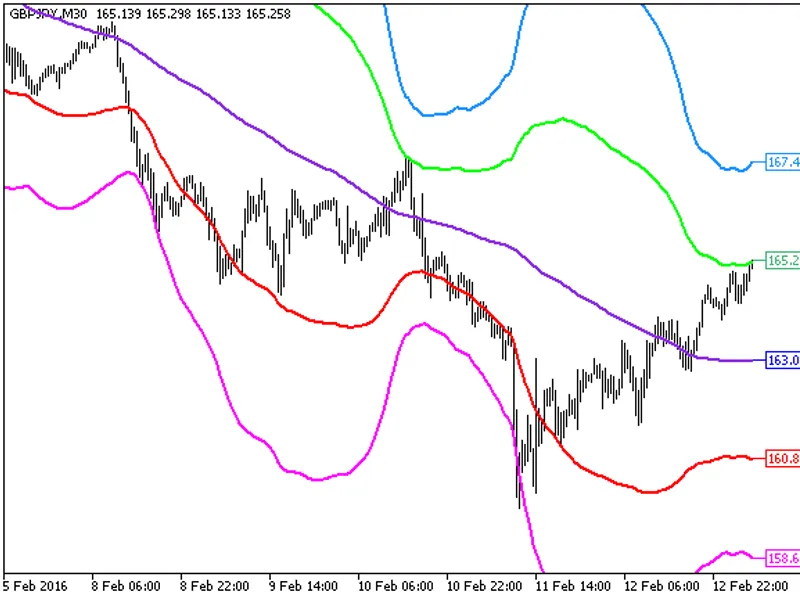
Three Bollinger Bands channels based on one Moving Average, displayed as a colored cloud.Features the display of last values as price labels.This indicator utilizes classes from th...
This indicator includes a timeframe selection option in its input parameters.The indicator requires the xma_bbx7_cloud.mq5 indicator file. Please place this file in the \mql5\indic...
The indicator features a timeframe selection option available in the input parameters.The indicator requires the forexline.mq5 indicator file. Please place this file in the \mql5\i...
The BB OS MA HTF indicator includes a timeframe selection option within its input parameters.This indicator requires the bb_osma.mq5 indicator file to be present in the \"\mql5\ind...
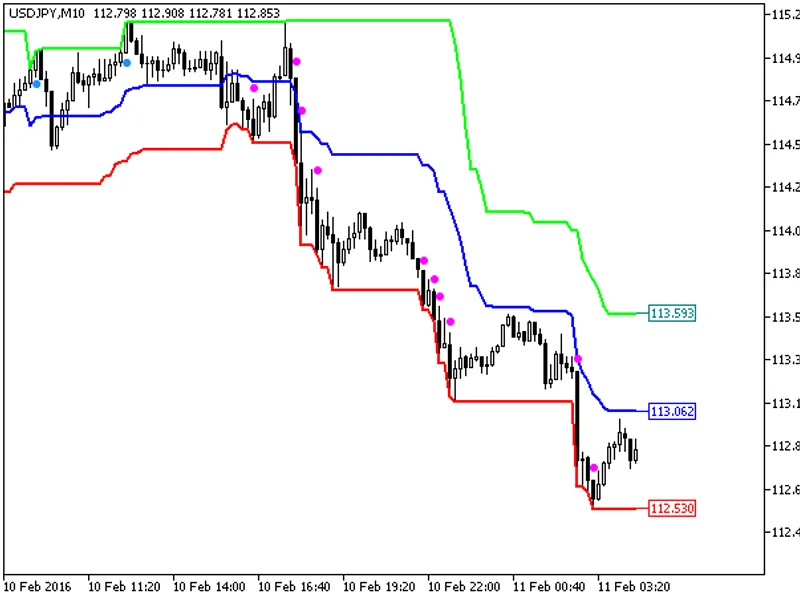
Three Bollinger Bands channels based on a single moving average, featuring the display of the last values as price labels.The indicator utilizes the smoothalgorithms.mqh library cl...
The indicator includes a timeframe selection option in its input parameters.
This indicator requires the notches.mq5 indicator file. Please place this file in the \\mql5\indicators...
Extrem N IndicatorA straightforward indicator designed to identify potential trend continuations or reversals based on price action over a specified number of bars.The indicator id...
Extreme Non-Repaint High Time Frame (HTF) Indicator
This indicator features a timeframe selection option within its input parameters.
The indicator requires the extrem_n.mq5 indica...
XMA BBX7 HTF Indicator with Timeframe SelectionThis indicator includes a timeframe selection option within its input parameters.The indicator requires the xma_bbx7.mq5 indicator fi...
A signal indicator that identifies reversal bars based on Bill Williams' Profitunity system, excluding angulation relative to the indicator mouth.Green marker (bullish reversal bar...
The Fast Stochastic indicator with noise reduction and timeframe selection, available in input parameters.This indicator requires the faststochastic.mq5 indicator file. Place this ...
A simple oscillator based on the difference between values of two moving averages.This can be achieved either by using two moving averages of different periods (fast MA - slow MA) ...
The indicator is implemented as a sequence of candlesticks.
Candlesticks appear as a result of the relevant price timeseries processed by the ColorXMACD indicator algorithm.
In man...
The classical RSI indicator implemented as a histogram with a color indication of entering the overbought and oversold areas.RSI Histogram IndicatorThe indicator visually represent...
A DeMarker indicator implemented as a histogram, featuring color coding to signal overbought and oversold conditions.DeMarker Histogram Indicator- Visual representation of the DeMa...
The classical Williams Percent Range (WPR) indicator, implemented as a histogram.The histogram visually indicates when the market is entering overbought or oversold areas.Figure 1:...
The classical MFI indicator implemented as a histogram with color indication for overbought and oversold areas.Figure 1. The MFI Histogram Indicator...
The classical Stochastic Oscillator implemented as a histogram.It features color indication for entering overbought and oversold areas.A colored cloud between the signal line and t...
The classical RVI indicator implemented as a histogram.The histogram includes color indication for entering overbought and oversold areas.A colored cloud is displayed between the s...
Stochastic Oscillator with Noise Reduction and Timeframe SelectionThis indicator features noise reduction and a timeframe selection option available in the input parameters.The ind...