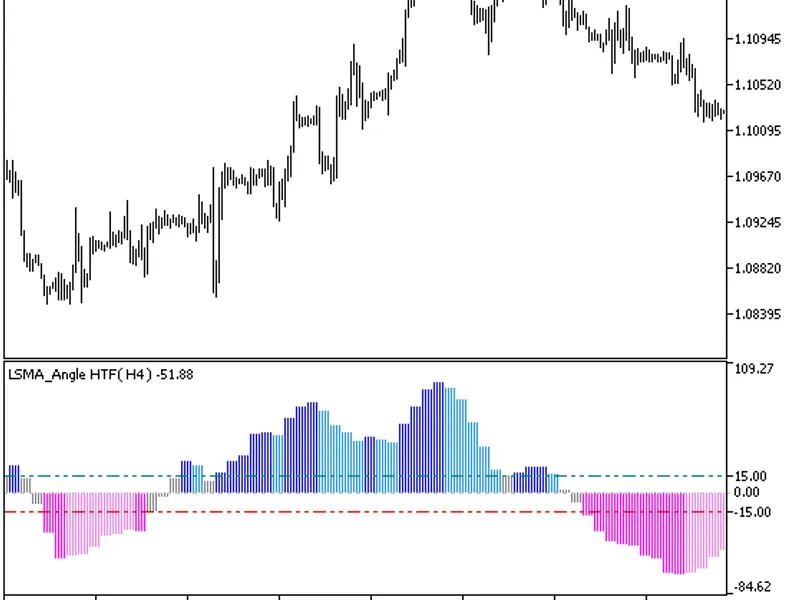
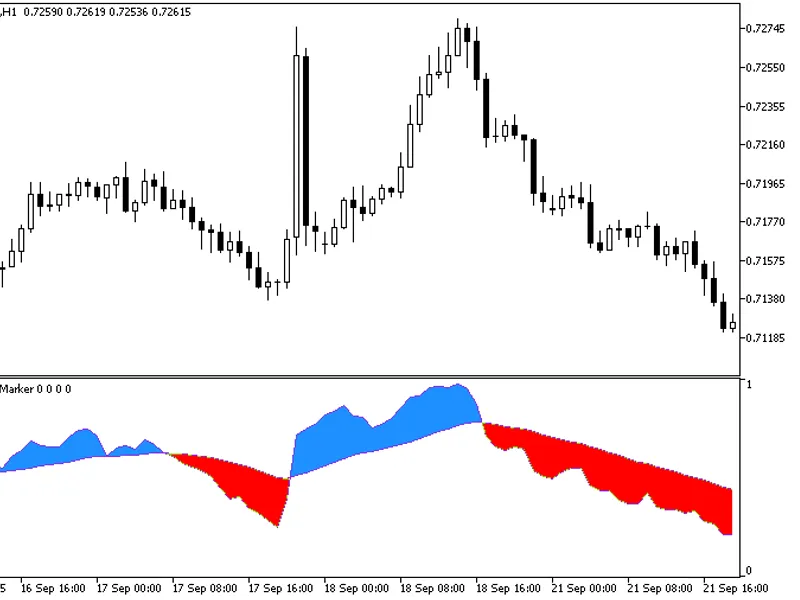
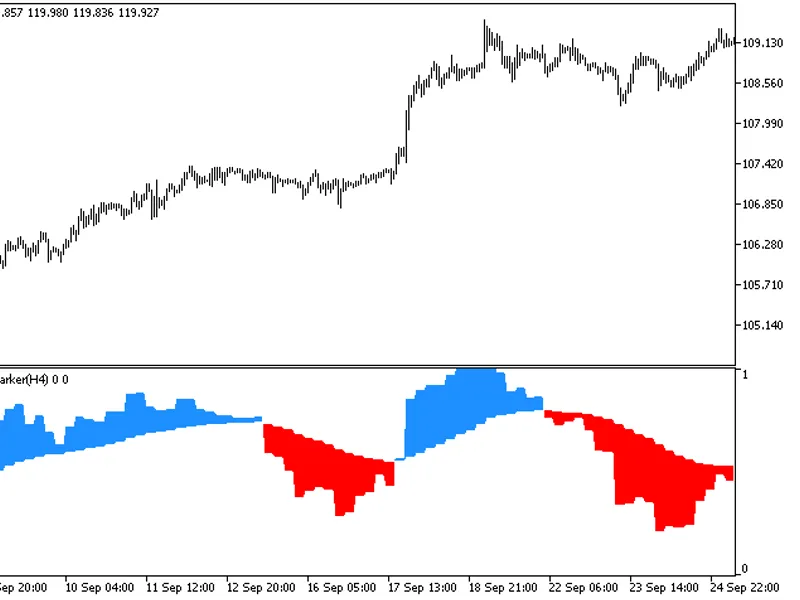
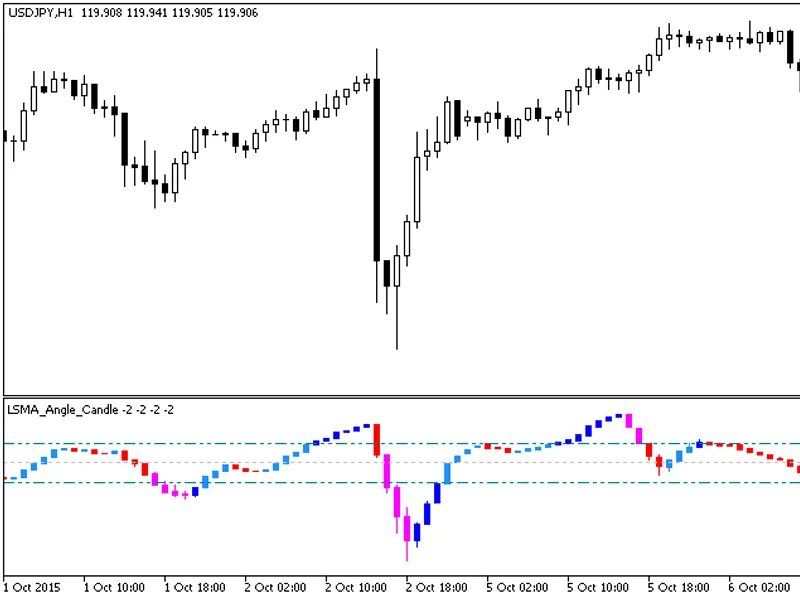
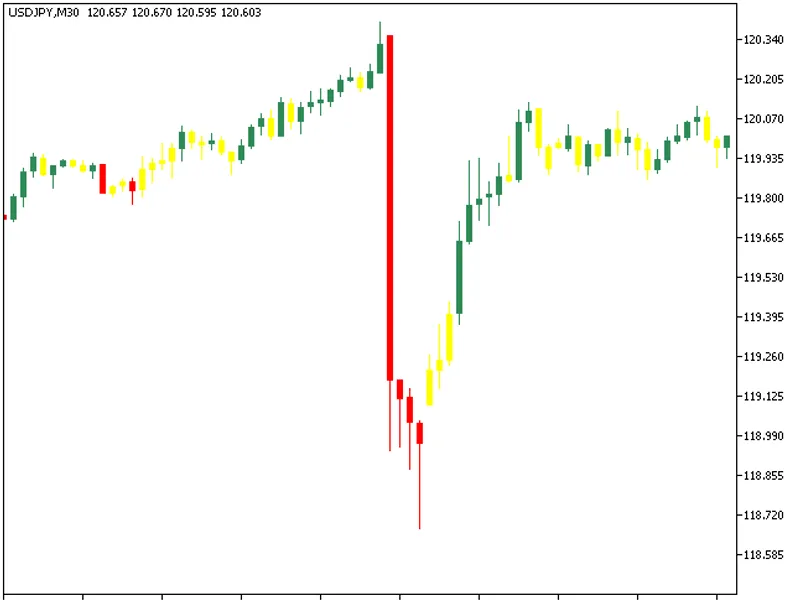
The LSMA Angle HTF indicator offers a timeframe selection option in its input parameters.This indicator requires the lsma_angle.mq5 file, which should be placed in the <terminal...
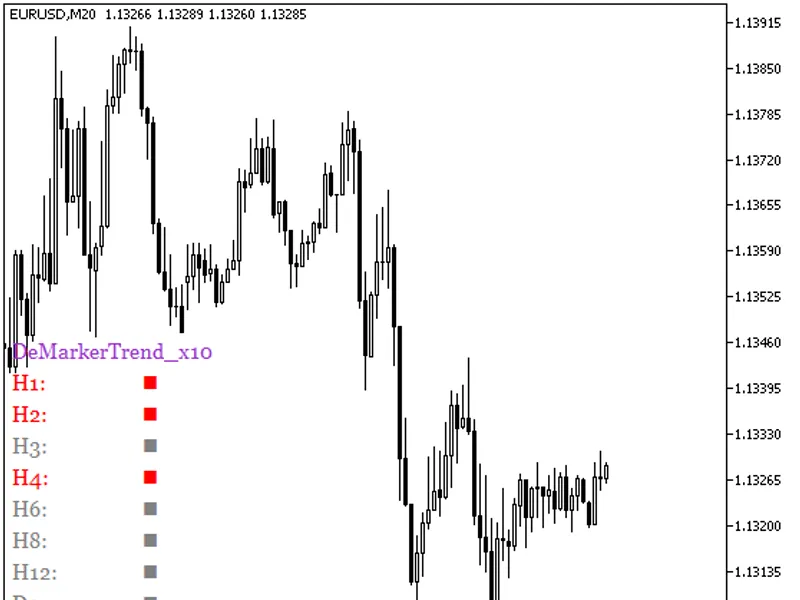
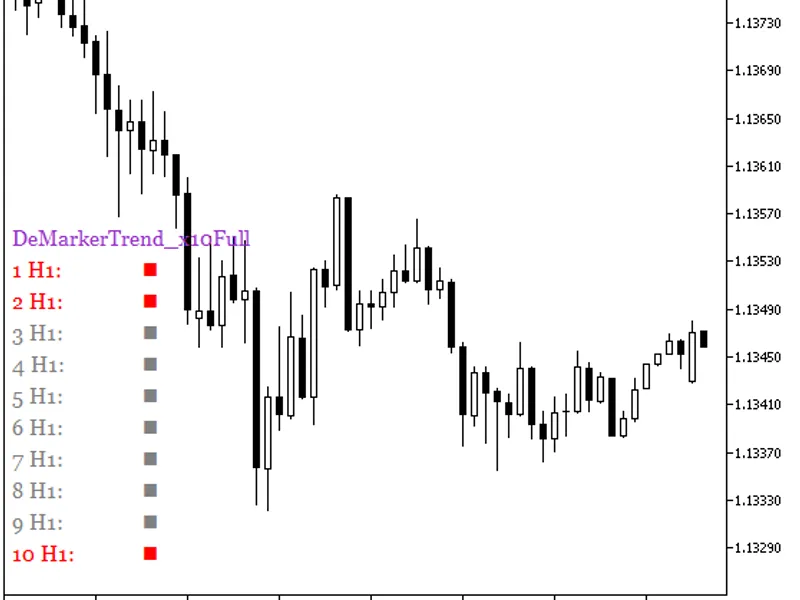
The DeMarkerTrend_X10 indicator displays the DeMarker oscillator's position across ten distinct timeframes.When the oscillator is below the oversold level, the color squares are re...
A variant of the indicator with customizable input parameters for each DeMarker oscillator, enabling individual customization of trend display.The indicator utilizes a class from t...
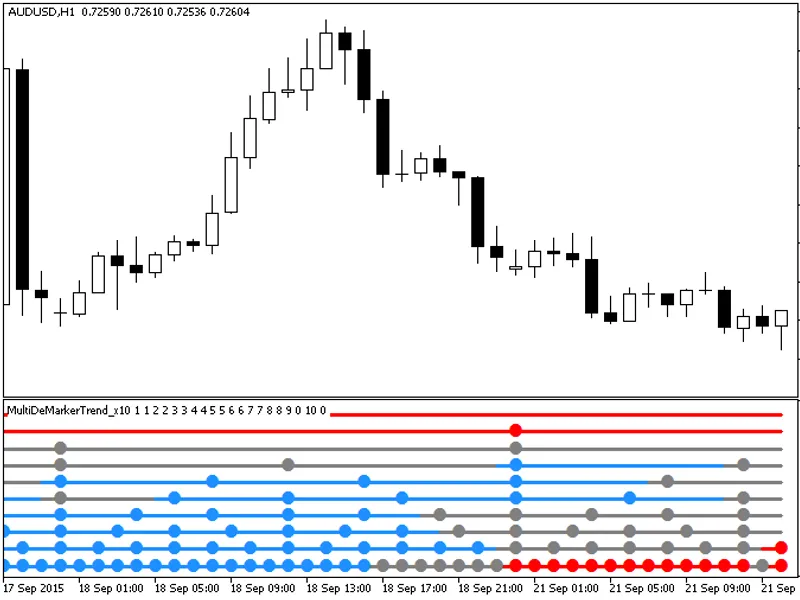
The MultiDeMarkerTrend_X10 indicator provides insights into current trends by utilizing the DeMarker oscillator's position across various timeframes.Each of the ten indicator lines...
This indicator is a variant of the DeMarker oscillator, calculated based on five DeMarker indicators.All editable variables are implemented as indicator input parameters. These var...
The indicator offers a timeframe selection option within its input parameters.To use this indicator, you'll need the colorzerolagdemarker.mq5 indicator file. Place it in the <te...
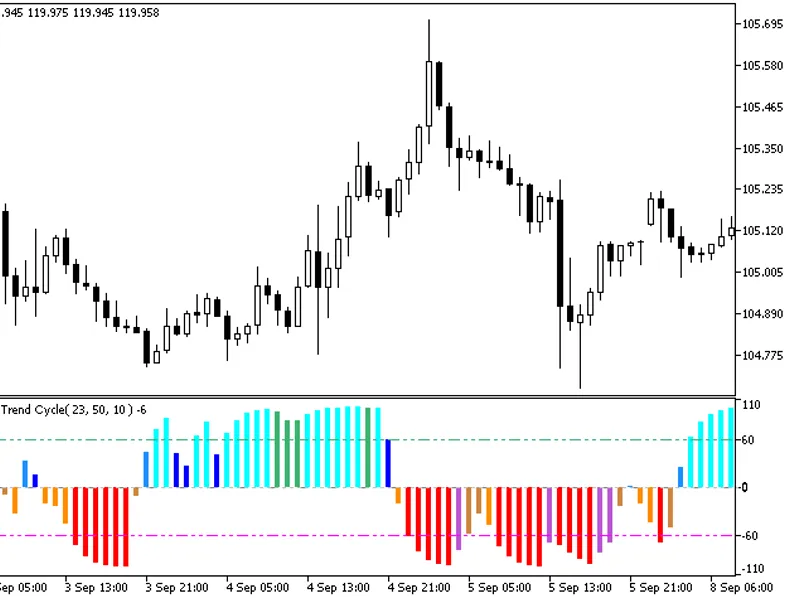
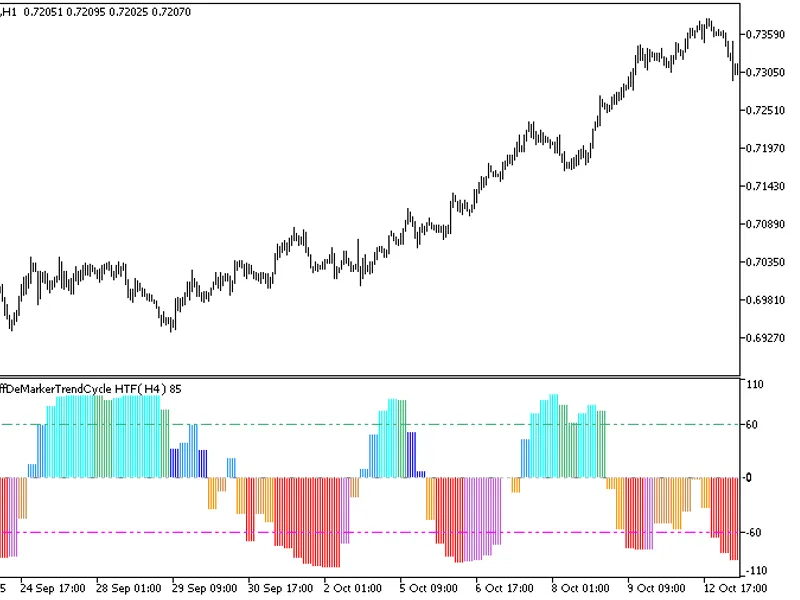
This indicator is based on the difference between two DeMarker oscillators with distinct periods.Fig. 1. Color Schaff De Marker Trend Cycle Indicator...
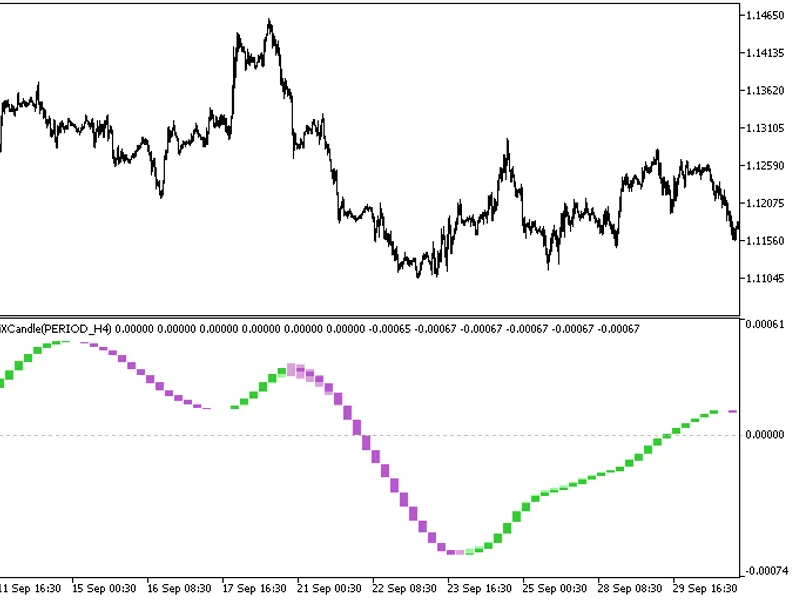
The indicator is a sequence of candlesticks, generated by processing relevant price timeseries with the LSMA_Angle_ algorithm.This approach can provide more informative analysis in...
The indicator offers a timeframe selection option in its input parameters.It requires the ColorSchaffDeMarkerTrendCycle.mq5 indicator file, which should be placed in <terminal_d...
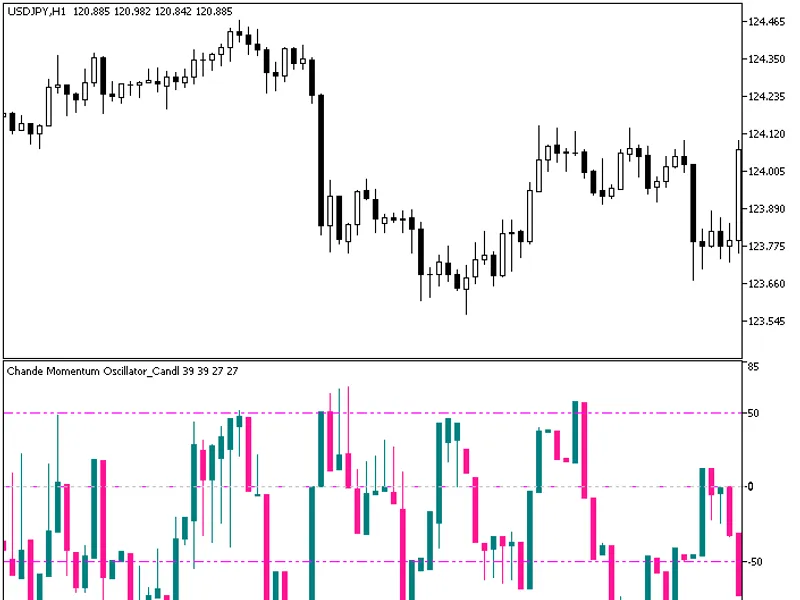
The indicator is implemented as a sequence of candlesticks, which are generated by applying the Chande Momentum Oscillator algorithm to relevant price time series.This approach can...
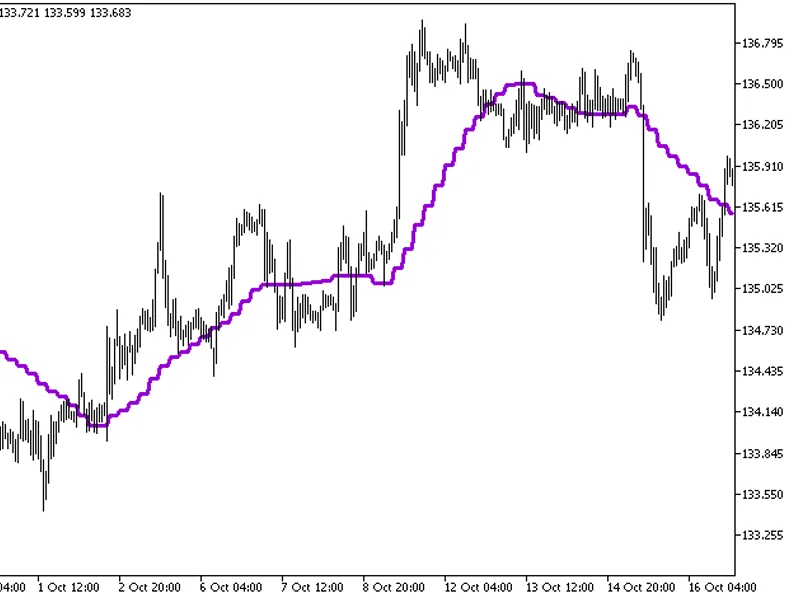
The indicator offers a timeframe selection option within its input parameters.To use this indicator, you'll need the ma_rounding.mq5 indicator file. Place it in the <terminal_da...
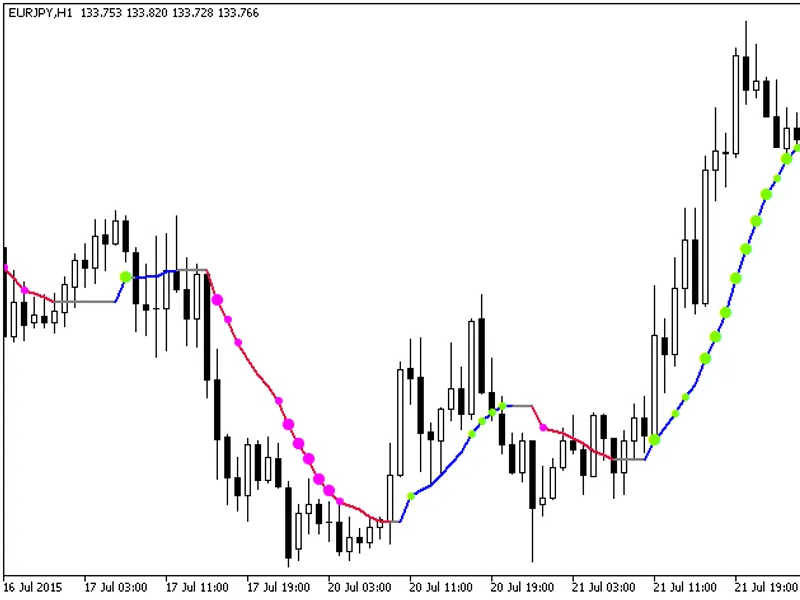
The MA Rounding with Standard Deviation indicator provides additional trend strength indication using colored dots based on the standard deviation algorithm.When the standard devia...
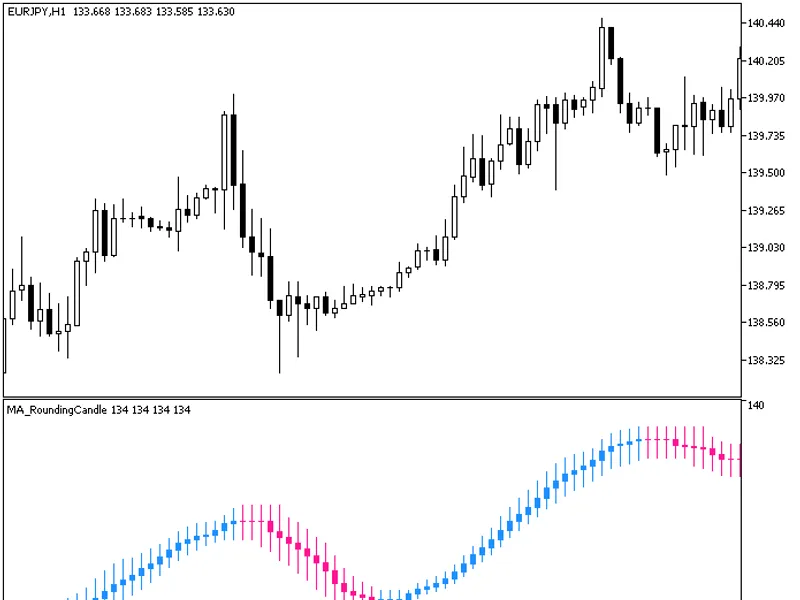
This indicator displays a sequence of candlesticks, each representing a specific price time series processed by the MA_Rounding algorithm.The MA_Rounding Candle indicator provides ...
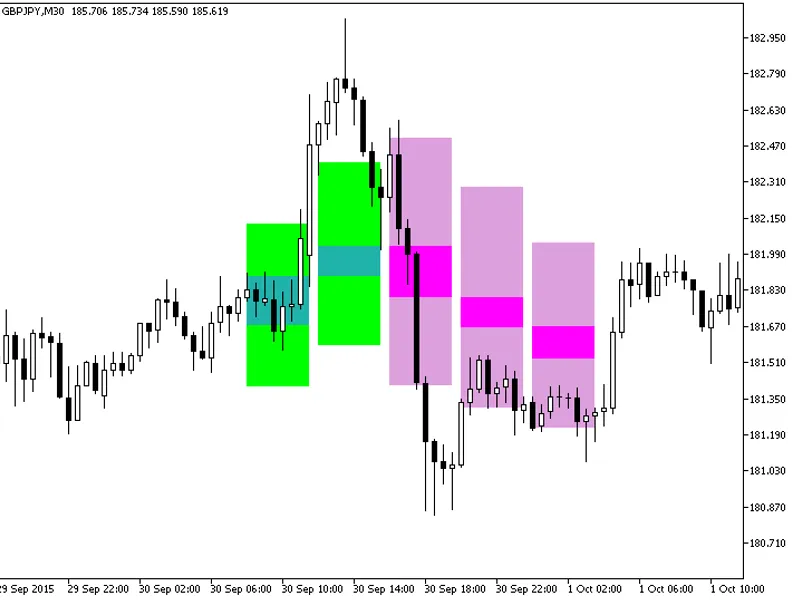
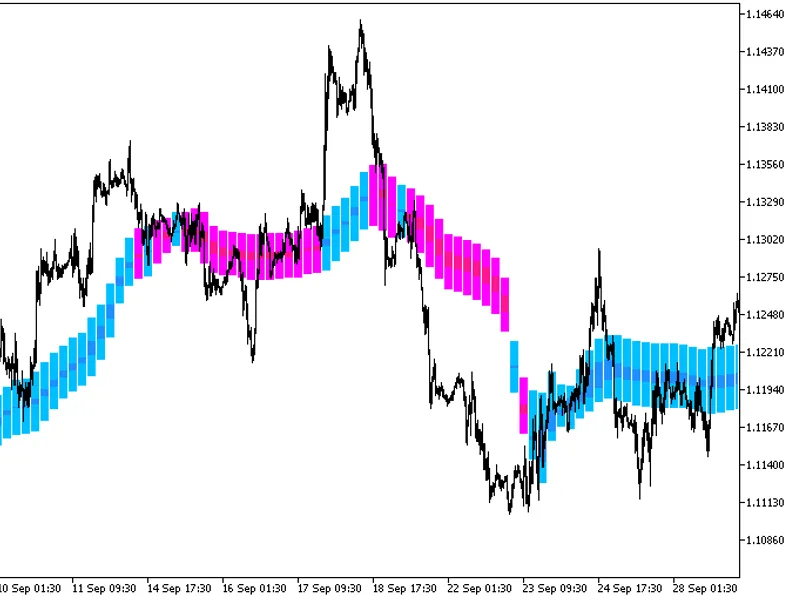
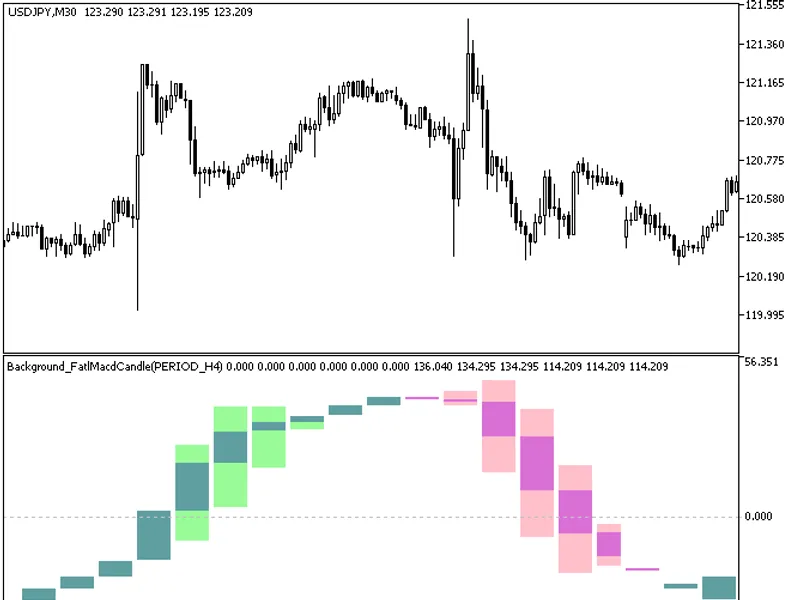
The indicator displays background candles of a larger timeframe as color-filled rectangles using buffers.Candlestick bodies are painted green or pink, depending on their direction,...
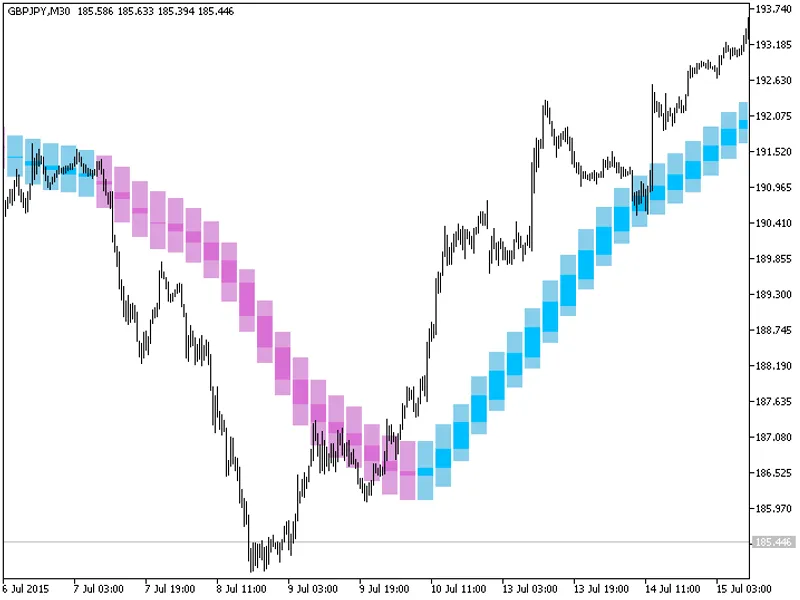
The indicator draws higher timeframe candlesticks as color-filled rectangles using buffers.Candlestick bodies are painted in sky-blue or purple, with shadows in light plum or pale ...
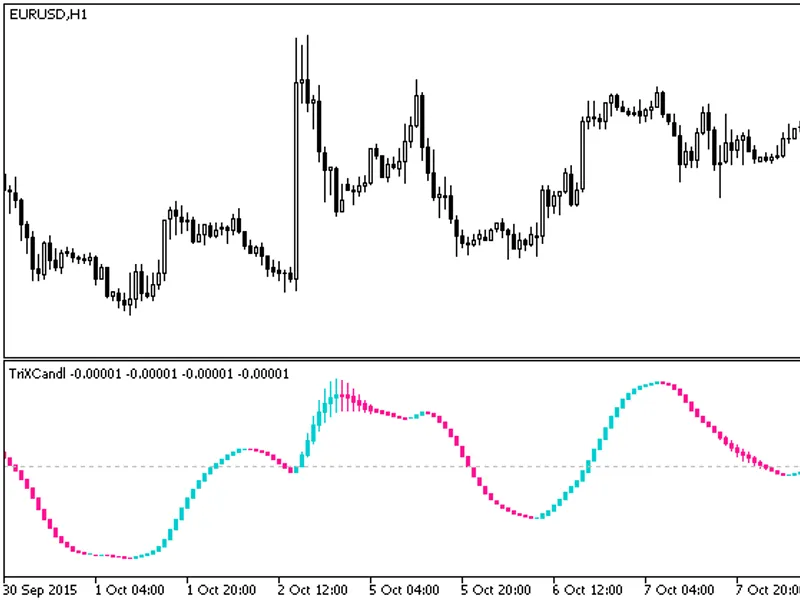
The indicator is a sequence of candlesticks, generated by applying the TRIX algorithm to relevant price time series data. This approach can provide a more informative analysis in c...
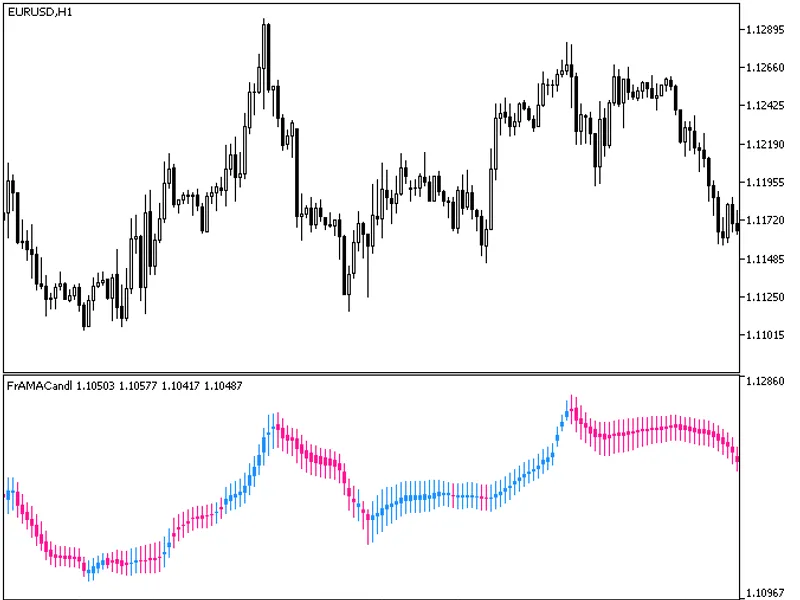
The indicator is a sequence of candlesticks, generated by processing relevant price timeseries through the FRAMA algorithm. This method can provide more insightful analysis in vari...
The indicator displays higher timeframe TrixCandle indicator values as color-filled rectangles using buffers.Candlestick bodies are colored emerald green or purple, depending on th...
The indicator draws higher timeframe candlesticks as color-filled rectangles using buffers.Candlestick bodies are painted blue or red, depending on the direction, and shadows are l...
This tool introduces a change in the display of graphical objects created by the strategy tester, simplifying the visual analysis of results without requiring code edits to the exp...
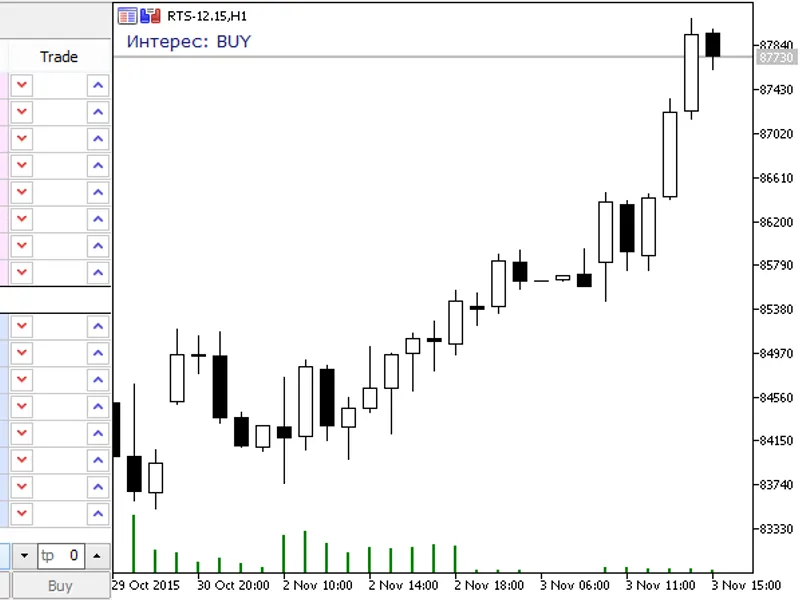
This is a market sentiment indicator that displays market sentiment, either bullish or bearish.The indicator is designed for centralized markets, such as Forts. It is important to ...
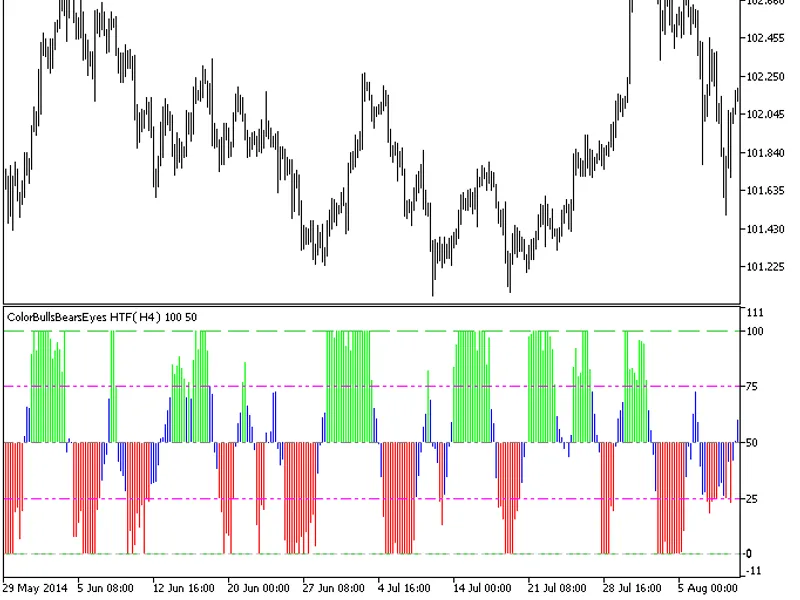
The indicator offers a timeframe selection feature in its input parameters.It requires the colorbullsbearseyes.mq5 indicator file, which should be placed in the following directory...
This indicator paints candlesticks based on the minimums and maximums of previous bars. It was originally written in MQL4 and first published on mql4.com in 2026. Fig. 1: SimpleBar...
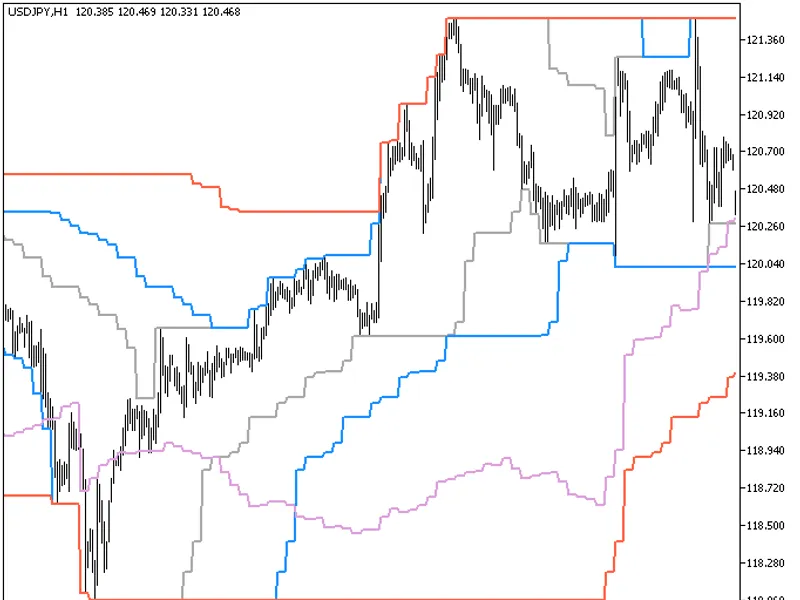
The Channel Breakout Entry HTF indicator offers a timeframe selection feature in its input parameters.To use this indicator, you need the channel_breakout_entry.mq5 file. Place it ...
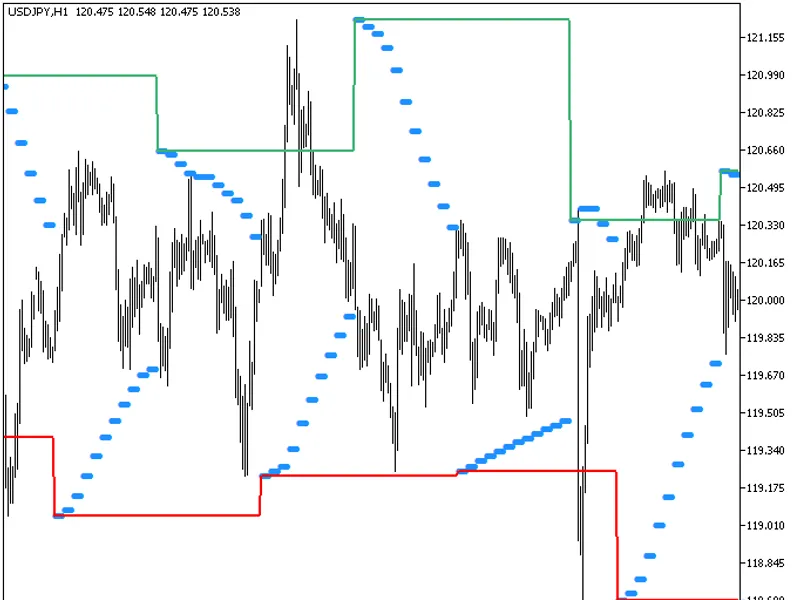
The indicator offers a timeframe selection feature in its input parameters.It requires the ChanellonParabolic.mq5 indicator file, which should be placed in the <terminal_data_fo...
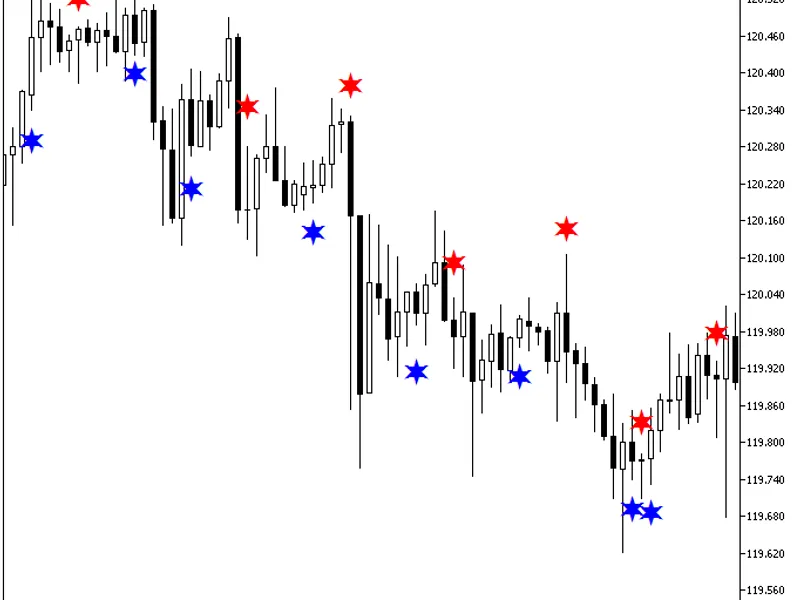
A semaphore signal indicator designed to provide trading signals based on the crossing of the oscillator with its signal line.The indicator offers a visual representation of market...
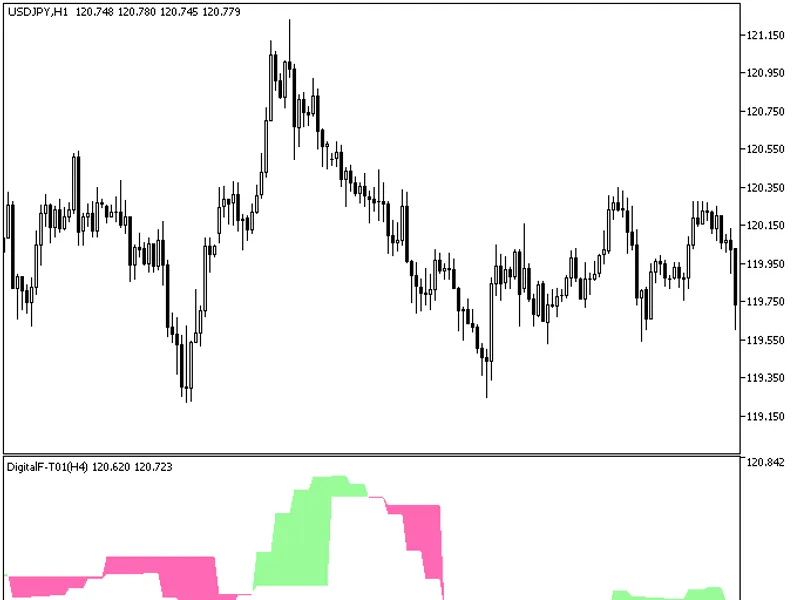
The indicator offers a unique feature: the ability to select the timeframe in the input parameters.To utilize this indicator, you'll need the digitalf-t01.mq5 indicator file. Ensur...
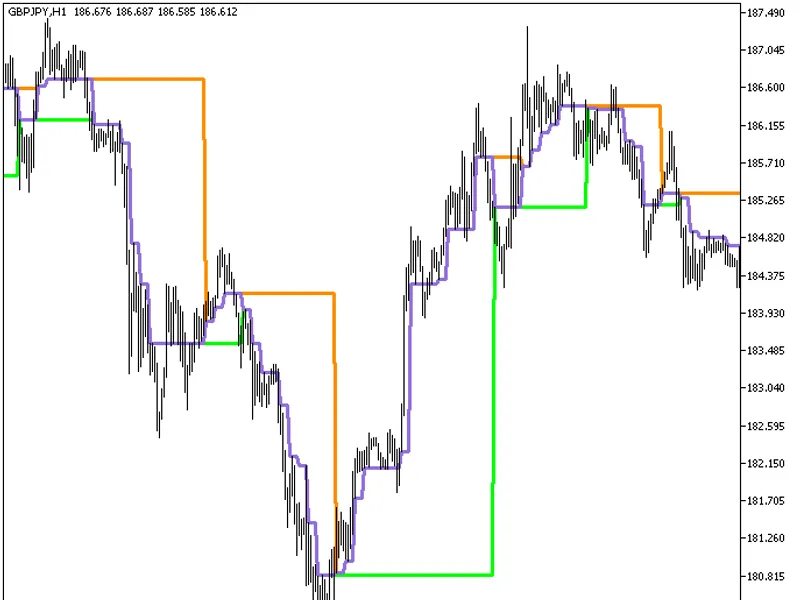
The Dynamic RS 3 Clines HTF indicator is a powerful tool that offers a unique feature: the ability to select the timeframe directly from the input parameters.This indicator require...
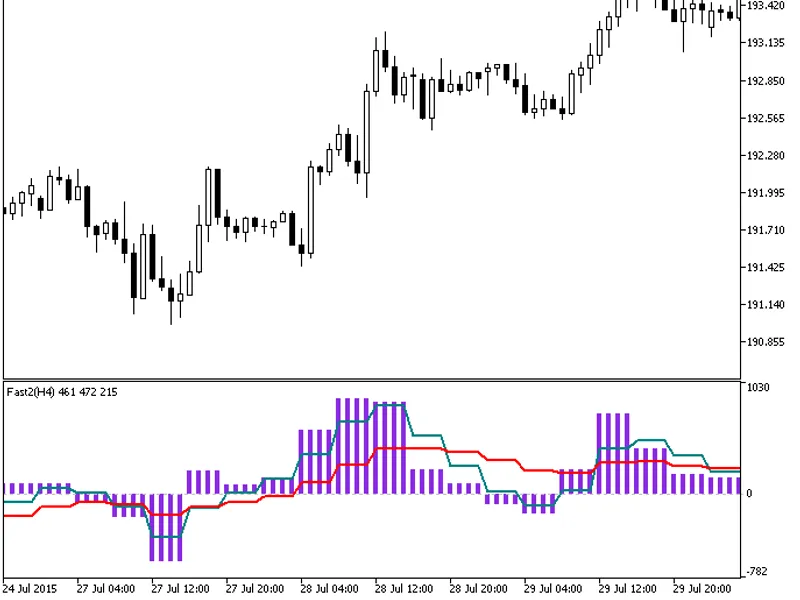
The indicator offers a timeframe selection feature in its input parameters.To use this indicator, you'll need the fast2.mq5 indicator file. Place it in \mql5\indicators.Fig.1. The ...
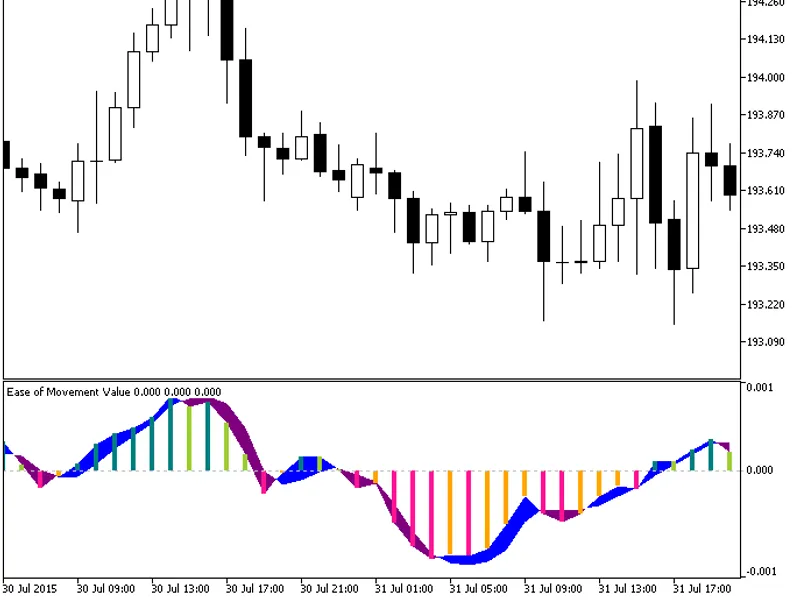
This indicator displays the EMV (Ease of Movement Value) in the form of a color histogram.It utilizes the smoothalgorithms.mqh library classes, which should be copied to <termin...
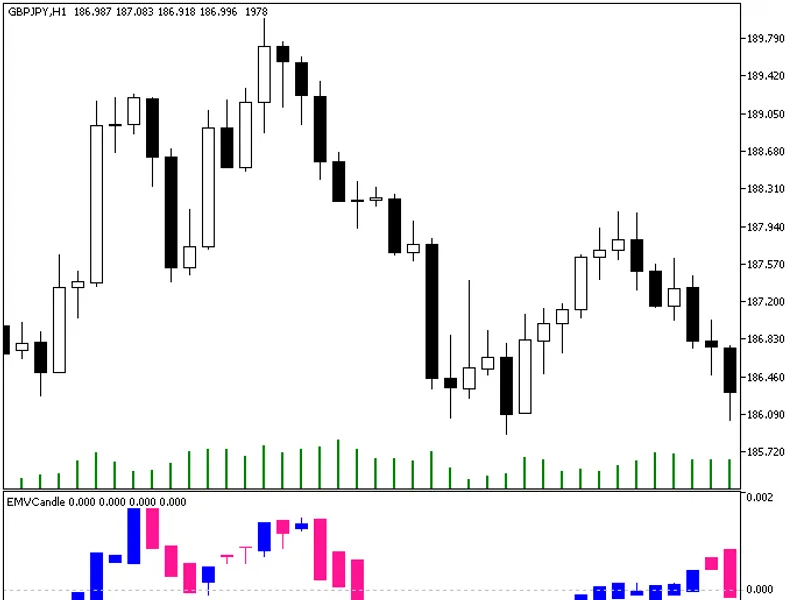
Indicator implemented as a sequence of candlesticks, which appear as a result of relevant price time series processed by the EMV algorithm.In various scenarios, this approach can p...
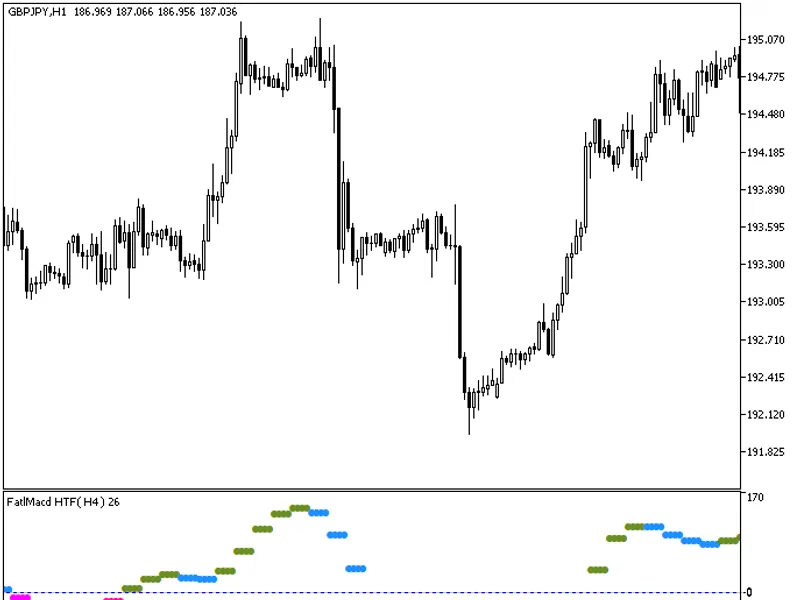
The indicator offers a timeframe selection option in its input parameters.To use this indicator, you need the fatlmacd.mq5 indicator file. Place it in <terminal_data_folder>\...
This indicator presents a unique approach to market analysis by transforming price data into a sequence of candlesticks, offering a fresh perspective on price action.The algorithm ...
The EMV Histogram HTF indicator offers a unique feature: the ability to select the timeframe directly from the input parameters.To use this indicator, you'll need the EMV_Histogram...
The indicator draws higher timeframe candlesticks as color-filled rectangles using buffers.Candlestick bodies are painted blue or red, and shadows are light blue or pink, depending...
The JFATL Candle indicator is a powerful tool for traders, offering a unique perspective on price action. It presents a sequence of candlesticks derived from the JFATL algorithm's ...
The indicator presents a unique approach to visualizing price data by transforming it into a sequence of candlesticks. These candlesticks are generated through the application of t...
The indicator displays higher timeframe candlesticks as color-filled rectangles using buffers.Candlestick bodies are colored green or purple, depending on their direction, while sh...
The indicator offers a timeframe selection option in its input parameters.It requires the EMA.mq5 indicator file, which should be placed in the following directory: <terminal_da...
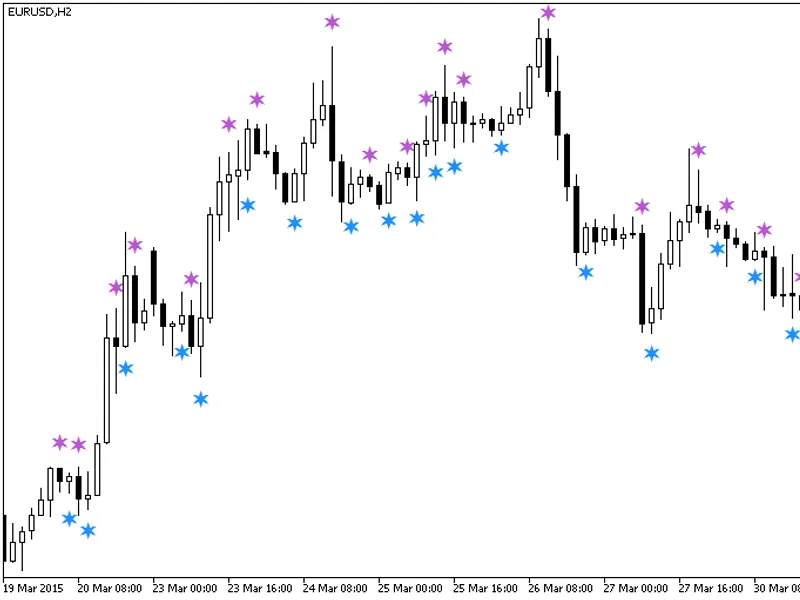
A semaphore signal indicator utilizing two indicators based on open and close values of the price series. Signals are generated when the difference between these indicators changes...
A semaphore signal indicator utilizing two indicators, derived from open and close values of the price series. Signals are generated when the difference between these indicators ch...
A semaphore signal indicator utilizing two indicators, calculated from the open and close values of the price series. Signals are generated when the difference between these indica...
This indicator displays a sequence of candlesticks, each representing a processed price time series using the FATLSATLOSMA algorithm. This visualization can provide valuable insigh...
A semaphore signal indicator utilizing two indicators based on open and close values of the price series. Signals are generated when the difference between these indicators changes...
A semaphore signal indicator utilizing two indicators based on open and close values of the price series. Signals are generated when the difference between these indicators changes...
A semaphore signal indicator that utilizes two OSMA (Oscillator Moving Average) indicators, based on the open and close values of the price series.Signals are generated when the di...
A semaphore signal indicator utilizing two CCI indicators based on the open and close values of the price series.Signals are generated when the difference between these indicators ...
A semaphore signal indicator that utilizes two momentum indicators, calculated from the open and close values of the price series.Signals are generated when the difference between ...