MT4 Orders Quick Report
This software component for MetaTrader 5 is built to enhance the capabilities of your trading environment. This library provides a collection of modular, reusable code. It is utilized by developers to organize common functions, allowing for the integration of complex logic across multiple Expert Advisors, indicators, or scripts without the need for code duplication.
How to Setup and Use MT4 Orders Quick Report
1. Storage: Place library files in the MQL/Libraries directory to ensure they are accessible to your projects.
2. Implementation: Include the library in your code using the #import directive, ensuring you match the exact function names and parameters.
3. Compilation: Ensure the library is present in the directory before you compile your main EA or script, as the compiler links them during this phase.
4. Management: Keep libraries organized in sub-folders if you manage many custom functions to maintain a clean project structure.
Frequently Asked Questions
Q: What is a library file used for? A: Libraries store reusable code modules, allowing you to centralize common logic used by multiple EAs or indicators.
Q: Is a library executable? A: No, libraries are non-executable files containing functions; they must be imported into an EA, indicator, or script to function.
Q: Can I update a library while the platform is running? A: You should compile your EA or script after updating a library to ensure the latest code changes are integrated.
Description & Settings
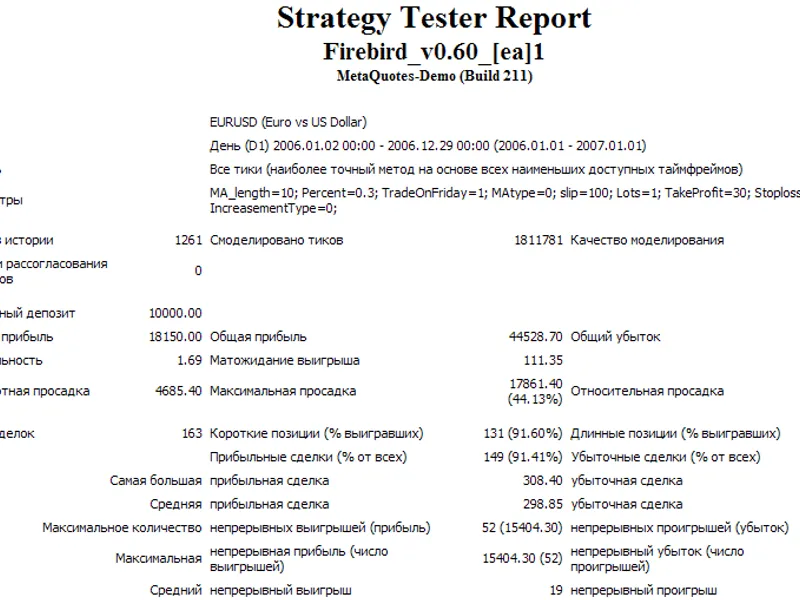
Works up to 10 times faster than Report, NTML file size is smaller, can upload and display up to 5.4 million report lines (screenshot below).
Functionality: (the same as Report)
Shows trades executed by MT4, MT5, their testers or tester.
Shows charts
Opens HTML file with report in a browser (requires permission to use DLL and #define REPORT_BROWSER command).
Differences from Report:
In MT5 side code, all data for the report is immediately output to the file as an array, without assembling lines with HTML code. This results in a great speed increase and reduction of file size.
Calculation of statistics, charting and generation of HTML code with lines of deals is done on the browser side in JavaScript code. A paginator is made, which shows the necessary page.
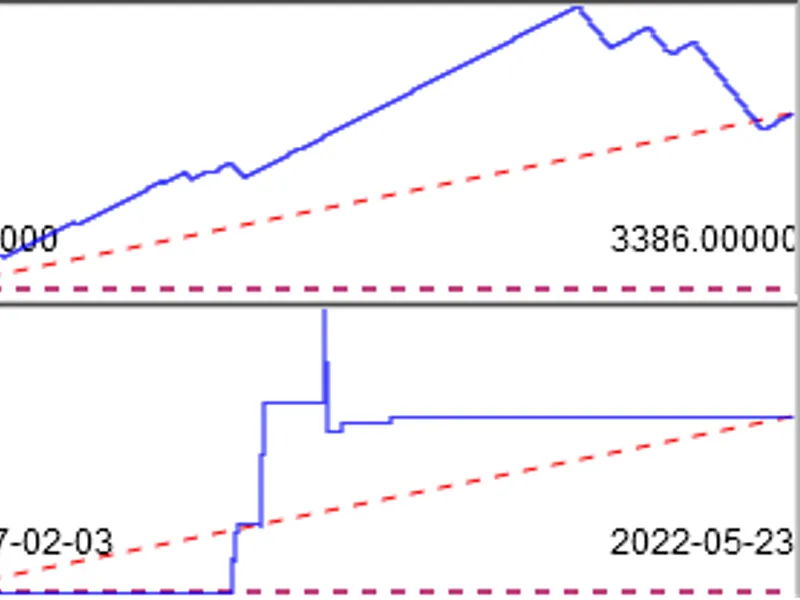
Charts display deals on a time scale rather than on a uniform scale by deal number. Thus, we can see that an Expert Advisor made 1000 deals in week 1 and was inactive for another 52 weeks. Here is an illustrative example with 3386 deals for 5 years: The same deals are placed on both charts. The upper chart is built with a
uniform step
between deals (as the MetaQuotes tester shows now). It looks promising. The lower chart is built
on a time scale
and shows that the Expert Advisor has traded only a few weeks in 5 years. 1 pixel horizontally = 1 week. According to the lower chart, it is immediately clear that there will be 2 years of inactivity in the beginning, then the Expert Advisor will trade for a few weeks and then 2.5 years of inactivity again. Such trading is not as interesting as the impression from the first chart.
The balance chart with options without slippage, without commission, without commission and slippage has been replaced by the profit (P/L) chart with the same options (without balance operations).
Added a separate balance chart, which will show balance operations deposits/withdrawals. This way you can see separately the work of trade operations on the P/L chart and their amounts with balance operations
If you click on any chart, an interactive Google.charts will open. In it you can zoom in and see the trades in detail. 4 P/L charts with 100,000 trades open for ~10 seconds.
The TurnOver chart is replaced by a chart with P/L for buys, sells and their amount. This way you can understand whether your strategy is bullish or bearish. You may decide to switch off one of the trading directions if it is not profitable. The chart of instrument closing price is shown below it. It is convenient to track how purchases make profit when the rate rises and sales make loss, and vice versa when the rate falls. If there are several instruments, their prices will be shown together, it is better to select only one of the instruments by filter to see only its price.
Added charts of slippages and cumulative slippages at opening, closing and their sum, the idea was taken from here .
A little rearranged the columns of the report, but there is a checkbox that will rearrange them as in Report-e. If you are more used to it.
When working in Virtual, you can make several calls to QuickReport and generate reports for each virtual (if there are several) and/or real MT5 tester
P.P.S. Works in both MT5 and MT4. Thanks to fxsaber for modification for MT4.
Improvement options:
You can try to unload the report into a binary file and read it in the browser, maybe it can work with a large 5.4 million number of rows. But then we will have to manually select the binary file due to security restrictions. That is, we will not be able to automatically open the report immediately after the test.