GS V - Greatest Swing Value MT F
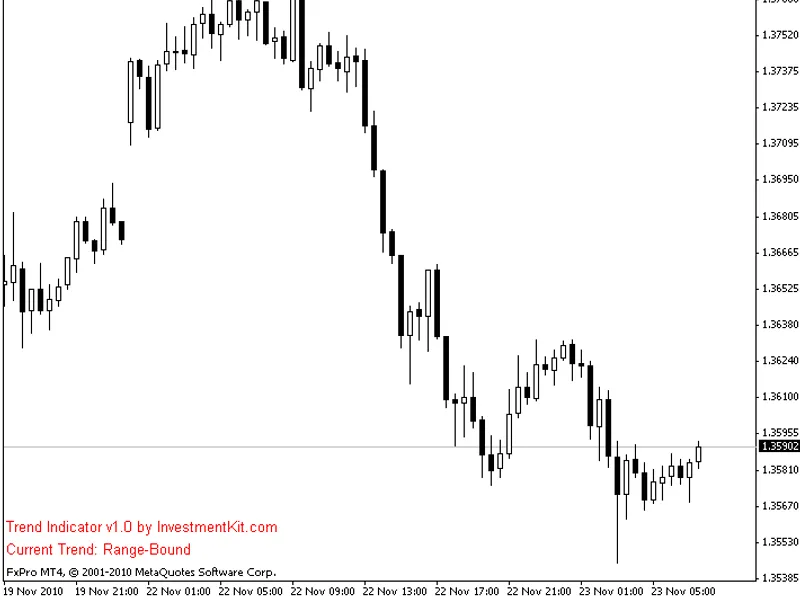
This is a powerful addition to your MetaTrader 4 toolkit designed to optimize market analysis and performance. This technical indicator acts as a specialized analysis tool designed to visualize market data. It helps traders identify emerging trends, momentum shifts, and key support or resistance levels by plotting statistical calculations directly onto price charts.
How to Setup and Use GS V - Greatest Swing Value MT F
1. Installation: Place your file in the MQL/Indicators folder via "Open Data Folder" and restart your terminal.
2. Loading: Find the indicator in the Navigator, drag it onto your chart, and configure the input parameters in the popup window.
3. Customization: Press Ctrl+I to open the indicator list, select your tool, and click "Properties" to change colors, levels, or visual styles.
4. Updating: Replace the old file in the Indicators folder with the new version and restart the platform to apply changes.
Frequently Asked Questions
Q: Why is my indicator not showing? A: Verify the file is in the MQL/Indicators folder, or try right-clicking the "Indicators" tree in the Navigator and clicking "Refresh."
Q: Do custom indicators slow down the platform? A: Too many complex indicators can impact performance; remove unused ones via the "Indicator List" (Ctrl+I).
Q: Can I use MT4 indicators on MT5? A: No, MQL4 and MQL5 are distinct languages; ensure the indicator is compiled specifically for your platform version.
Description & Settings
"Each day you have a buy swing and a sell swing from the open price. The direction of the close ± the open tells us which side won the battle. Adding up all the open to low swings [selling pressure] and open to high swings [buying pressure] for the past few days, shows the average of the amount of directional swings that have taken place. A swing from the open price that exceeds this average may be indicative of a signal." - Larry Williams concept "greatest swing value (GSV)" from his book 'Long-term Secrets to Short-term Trading'.
The indicator is MultiTimeFrame, so by default is set to Daily for interpolation on lower timeframes.You can apply Current timeframe in settings to recalculate by chart timeframe.