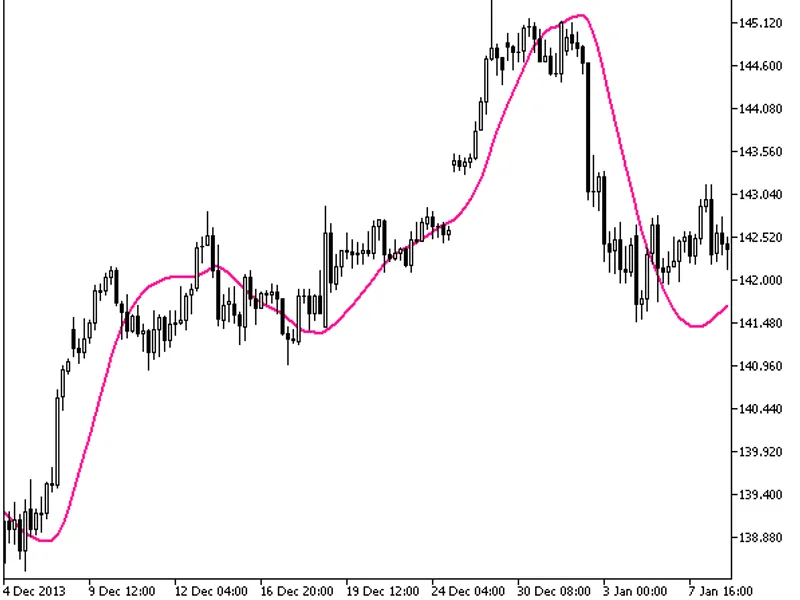
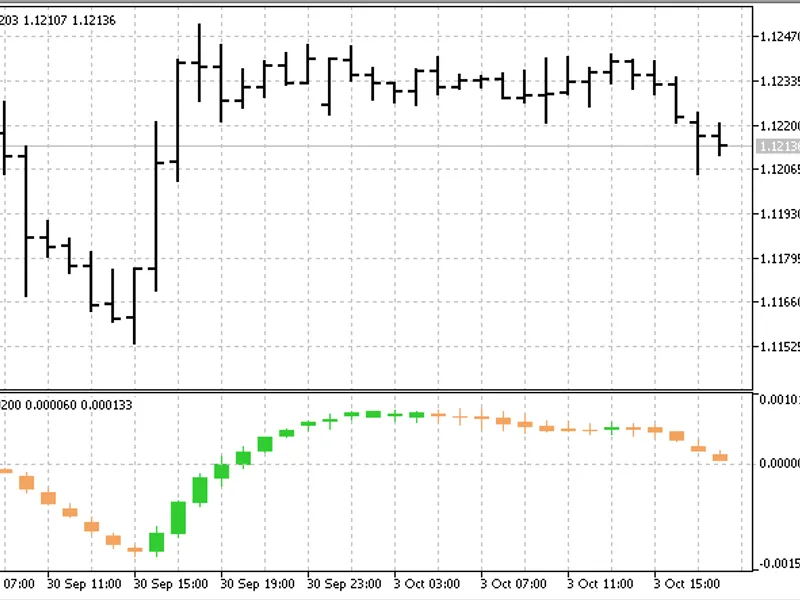
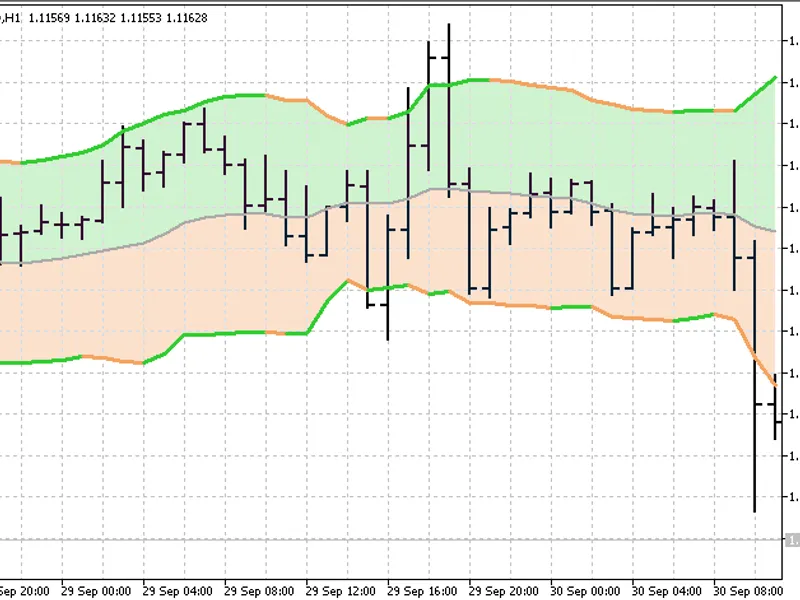
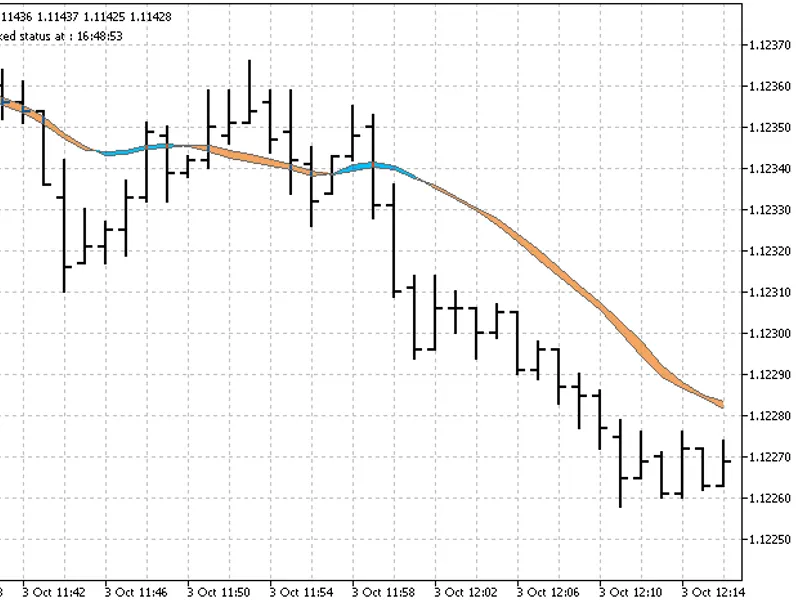
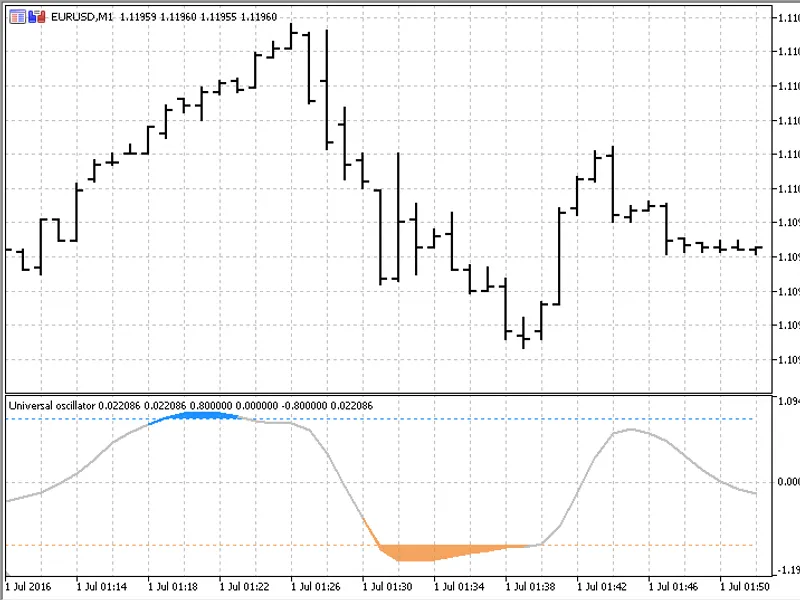
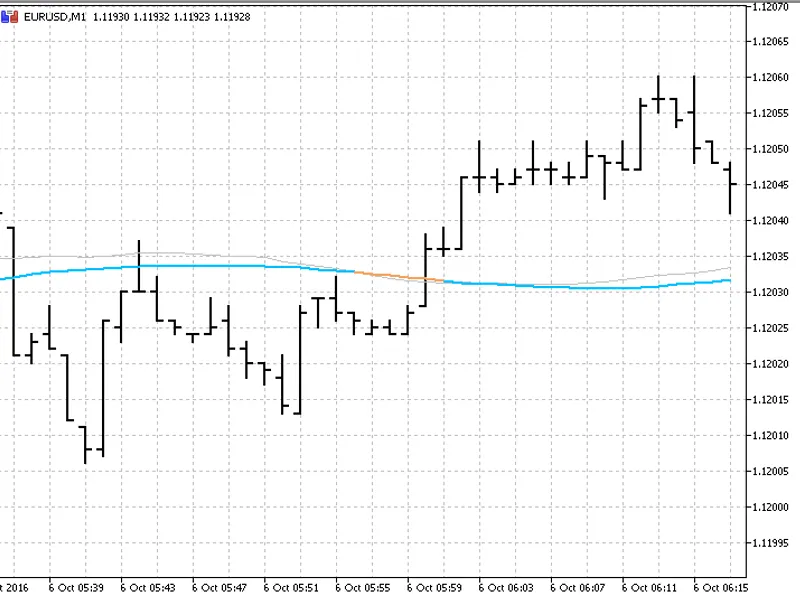
The STLM digital filter implemented as a sequence of candlesticks. Candlesticks are generated by applying the ColorSTLM_Histogram indicator algorithm to relevant price time series....
This indicator is a hybrid of the Slow Adaptive Trend Line (SATL) digital filter and the JMA adaptive smoothing algorithm.The average is calculated as follows:where:SATL() — value ...
The AFL Winner indicator provides a visual representation of indicator entries into overbought and oversold areas using color-coded histograms. Pale histogram tones indicate a simp...
The XChannel HTF indicator offers a unique feature: the ability to select the timeframe directly from the input parameters.To utilize this indicator, ensure you have the xchannel.m...
The ATR Channels HTF indicator offers a unique feature: the ability to select the timeframe.This indicator requires the atr_channels.mq5 file, which should be placed in the <ter...
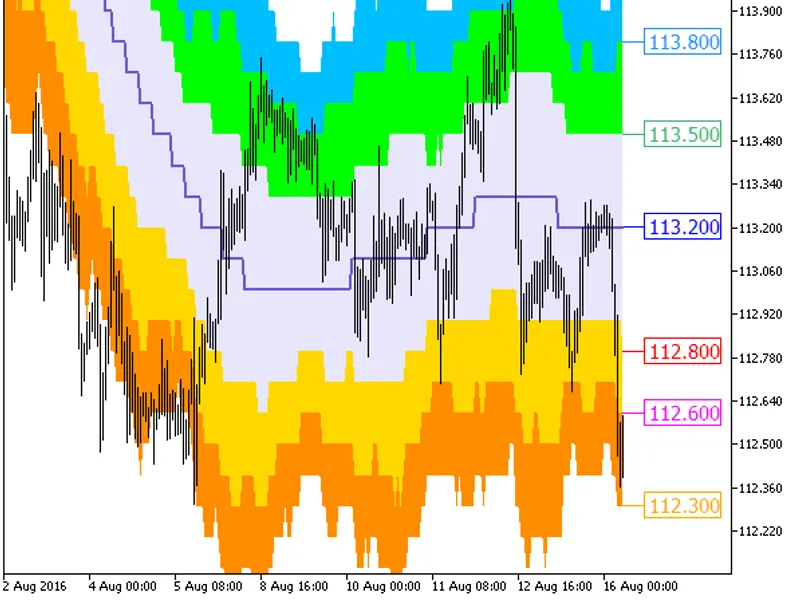
Three channels using the ATR indicator, based on one moving average, drawn as a colored cloud, with the display of the last values as price labels and the option to round channel l...
The MACD histogram, based on the FATL and SATL digital filters with color indication of trends.The indicator uses SmoothAlgorithms.mqh library classes (copy it to \mql5\include).Fi...
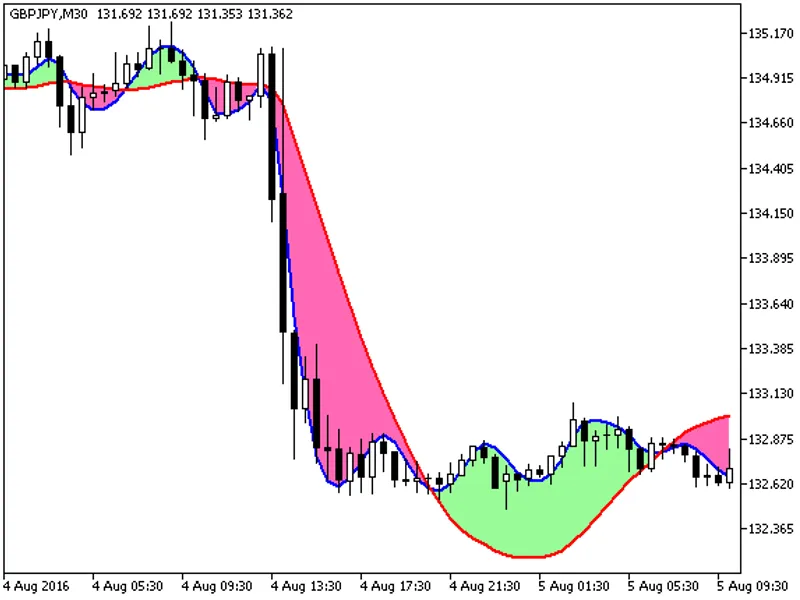
This indicator is based on smoothed Fatl and Satl digital filters and the signal trend cloud between them.The indicator utilizes the smoothalgorithms.mqh library classes, which sho...
This lightweight cross-platform library enables efficient and rapid comparison of 'double' values for the 'price' variable.For instance, prior to executing a selllimit order, it ca...
This indicator introduces new input parameters and additional functionality to the original Elliott Wave Oscillator.New functions added: buysignal(), sellsignal(), and getstringtim...
A simple trend indicator that calculates the rise and fall in high and low prices.Calculation formula:i4_drf_v2=100 * (psum - nsum) / periodwhere:psum — the number of candles in th...
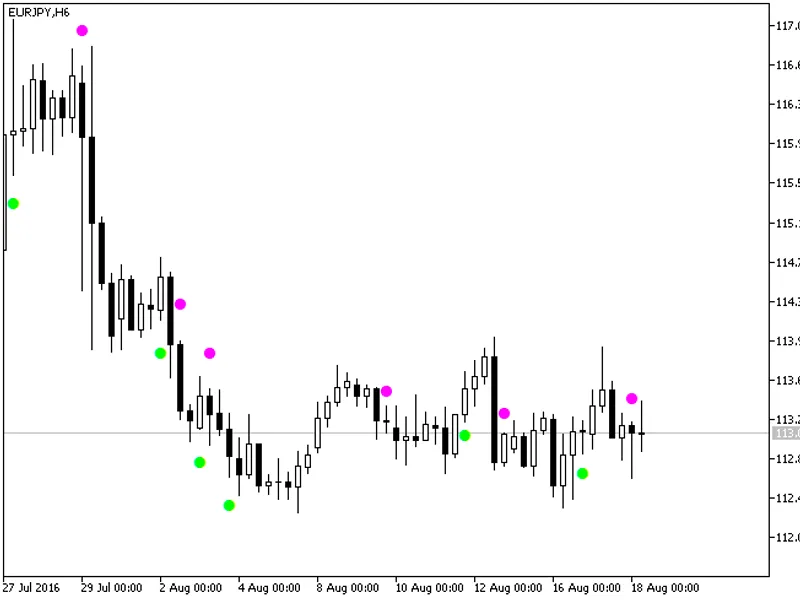
The BS Living Now indicator identifies market extremums, resembling the standard fractals indicator. While similar in appearance, they differ in their underlying calculations and f...
The CronosChaikin_Signal indicator provides insights into the current trend by utilizing the values of the indicator with a fixed timeframe.It generates signals based on the relati...
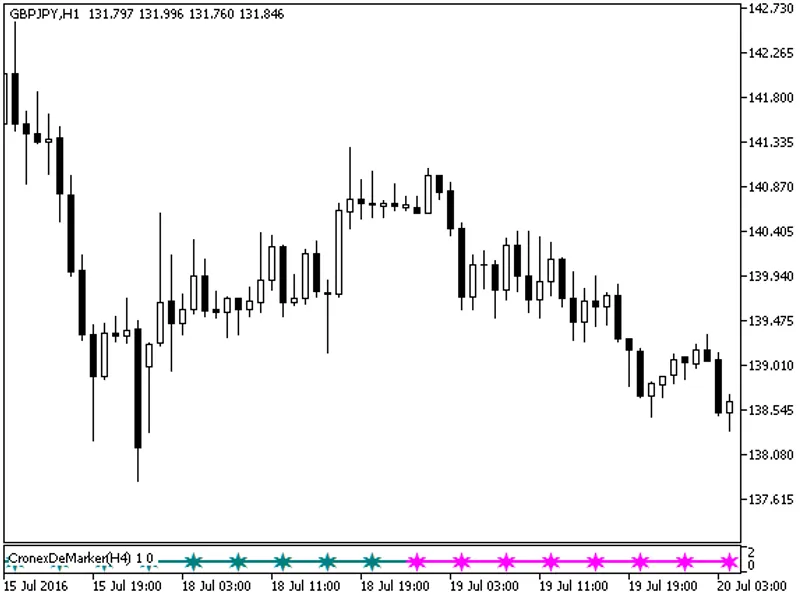
The CronExDeMarker_Signal indicator provides valuable insights into the current trend by utilizing the values of the CronExDeMarker indicator with a fixed timeframe.This indicator ...
The indicator offers a timeframe selection feature in its input parameters.Note: The indicator requires the pricechannel_stop_digit.mq5 file. Place this file in the <terminal_da...
The OSHMA HTF indicator offers a unique feature: the ability to select the timeframe.This indicator relies on the OSHMA.mq5 file, which should be placed in the following directory:...
J.B.This moving average indicator has the ability to change the averaging algorithm.The indicator uses smoothalgorithms.mqh library classes (copy it to \mql5\include). The use of t...
The indicator with the timeframe selection option in the input parameters.Requires the FloatPivot.mq5 indicator file. Place it in /mql5/indicators.Fig.1. The FloatPivot_HTF indicat...
The Float Pivot Digit indicator features a color-filled channel, presented as a cloud, with price labels displaying the latest values. It allows for precise control over channel le...
The RSI indicator is implemented as candlesticks, offering a unique visual representation of price action. This indicator provides valuable insights by displaying candlesticks that...
This indicator offers a timeframe selection feature in its input parameters.To use this indicator, you need the balanceofpower_histogram.mq5 indicator file. Place it in <termina...
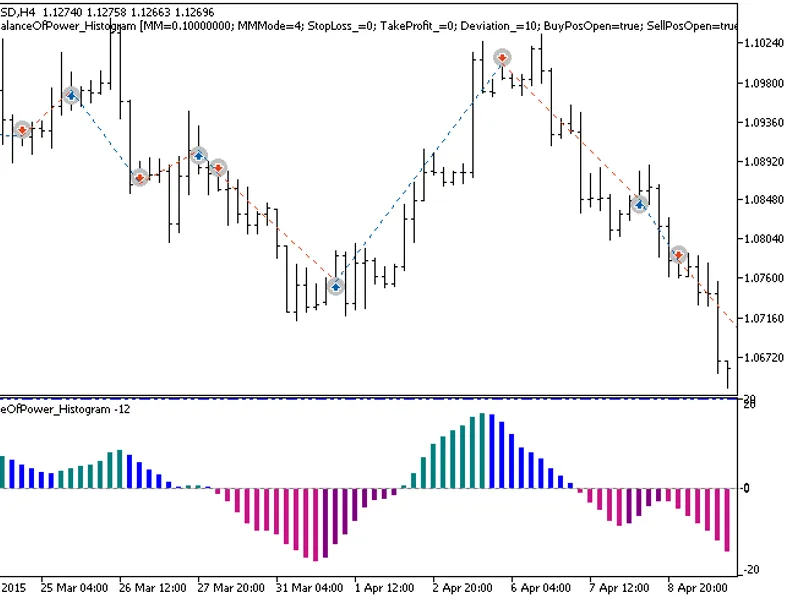
The Balance of Power Histogram Expert Advisor is designed to react to changes in the direction of the Balance of Power Histogram indicator. It generates signals when a bar closes a...
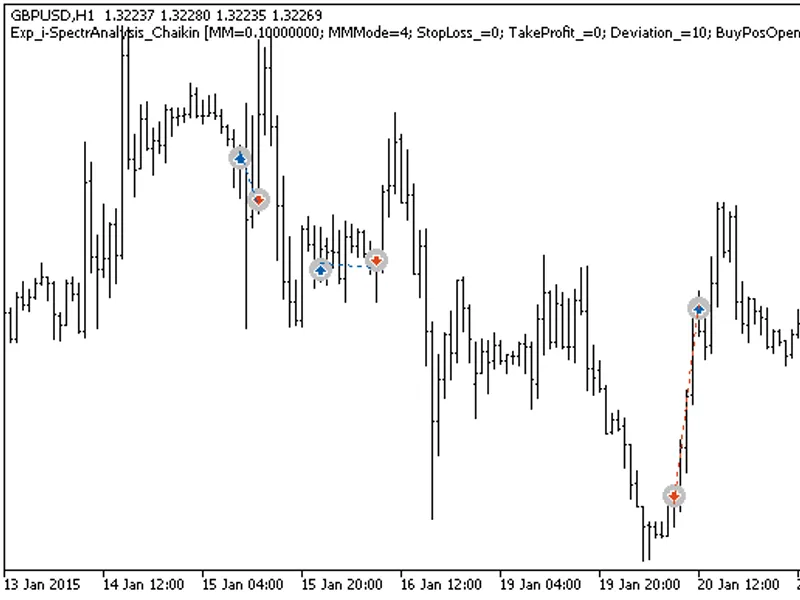
The Exp I-Spectranalysis Chaikin Expert Advisor is designed to react to changes in the direction of the indicator. It generates a signal when a bar closes if there is a change in t...
IgoradTrend indicator. The location of the histogram and the signal line of the indicator relative to the 0 level can serve as the reference mark to determine the trend. The inters...
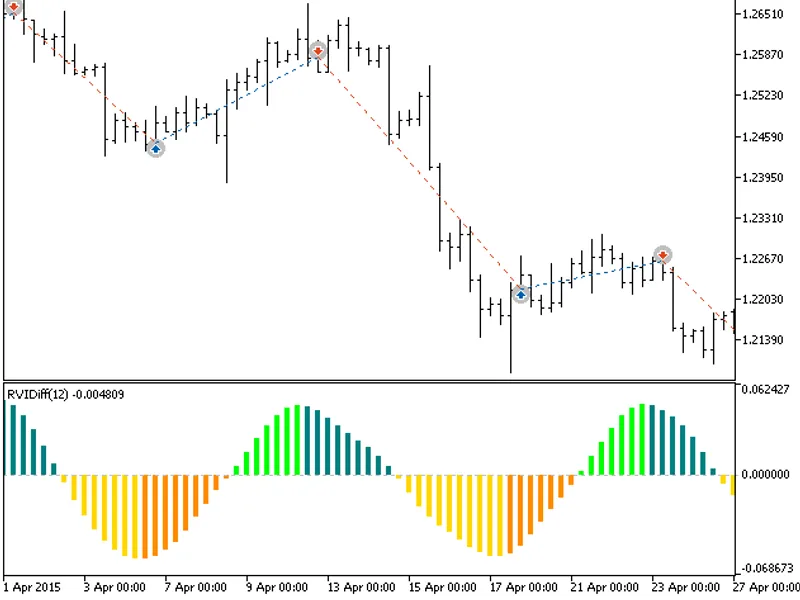
The Exp RV i Diff Expert Advisor is designed to operate based on the direction change of the indicator. It generates signals when a bar closes and there is a shift in the histogram...
The indicator with the timeframe selection option available in the input parameters:This indicator requires the rvidiff.mq5 indicator file. Place it in \mql5\indicators.Fig.1. The ...
This indicator is based on two moving averages from the book by John Ehlers. It provides a unique visualization of market trends and potential reversal points.The Laguerre Filter C...
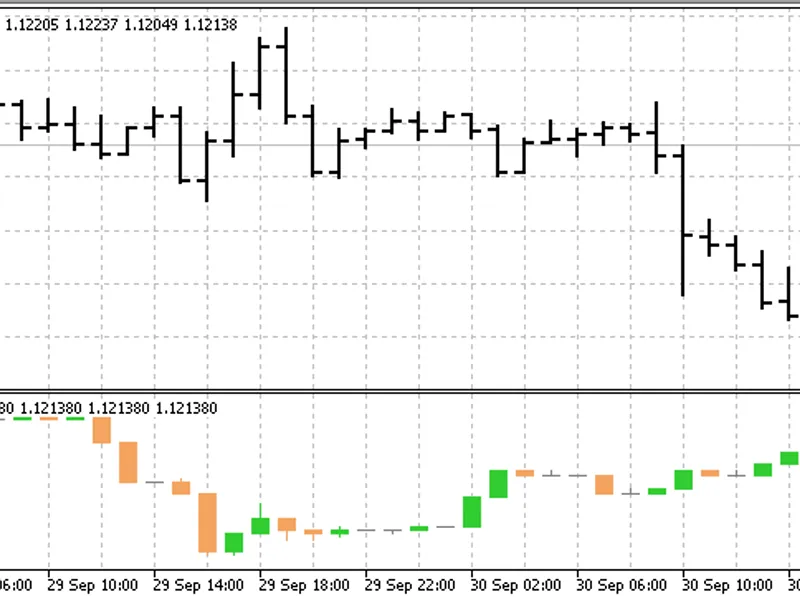
Trading system based on indicator signals. A signal to perform a deal is generated at the close of a bar when the indicator candlestick color changes between blue-green and orange....
This indicator offers a timeframe selection option within its input parameters.To use this indicator, you need the stochasticdiff.mq5 indicator file. Place it in the <terminal_d...
The default chart grid has certain limitations that hinder quick assessment of price movements. The grid step adjusts dynamically when changing timeframes, and it doesn't align wit...
This cross-platform library enables byte-wise operations with structures and standard data types, offering a range of features:- Byte-wise comparison (== and !=) of structures and ...
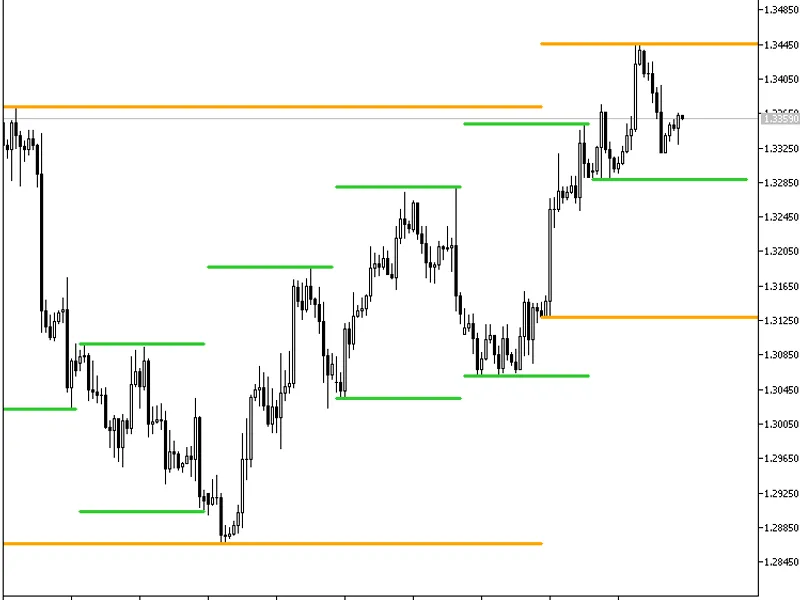
This script provides a clear visualization of monthly and weekly levels on the chart.Parameters:- Number of Days: Set the number of days for calculation.- W1 Color: Choose the colo...
The Price Position indicator is a powerful tool that provides valuable insights into price movements relative to a specific angle. It offers traders a unique perspective by indicat...
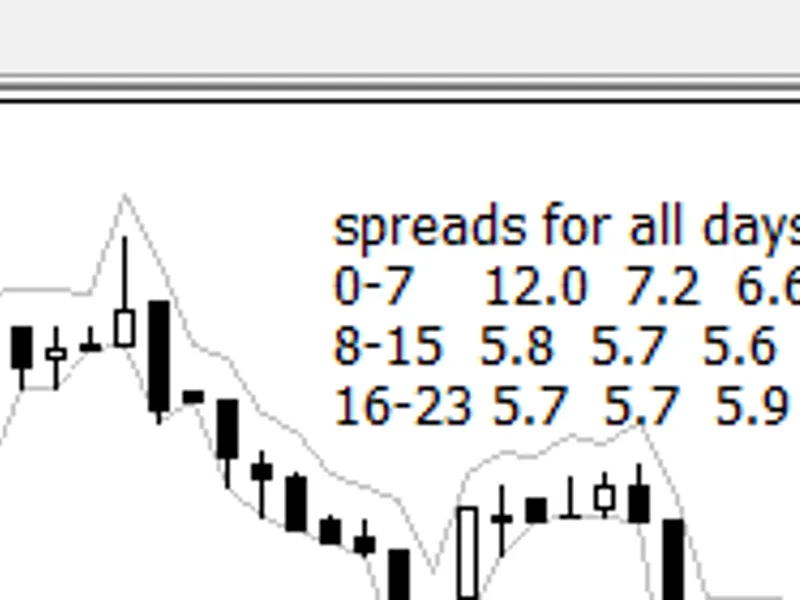
This tool provides valuable insights for optimizing your Expert Advisor (EA) entries by analyzing historical spread data for specific instruments.Each line represents an 8-hour per...
The Advanced Encryption Standard (AES) is a symmetric block cipher used for protecting classified information by the U.S. government and is widely implemented in software and hardw...
This indicator generates custom timeframe candles based on a specified time interval in seconds. Unlike traditional indicators, it operates independently of bars or ticks, ensuring...
This indicator calculates four MACD values (of open, close, high, and low) and constructs MACD candles from these values.The color of the candles and the trend they indicate depend...
This indicator automatically identifies the minimum and maximum values within a specified period and draws Fibonacci zones between these bounds. The highest high and lowest low of ...
This indicator offers Bollinger Bands with a unique feature: the ability to choose between two deviation types.While the difference may seem minor, it provides valuable flexibility...
This indicator provides a basic introduction to quantiles and their application in technical analysis.The Quantile Bands indicator constructs bands using three quantile values, off...
This indicator alerts you when a new bar forms on the chart. It offers customizable alerts through text, sound, and email notifications.You can configure the alert settings to suit...
This indicator is a powerful tool for traders, providing a clear visual representation of market trends and potential turning points.It calculates and displays fast and slow moving...
This indicator displays candles based on four moving averages: the average of open, close, high, and low prices. It includes four types of moving averages: simple, smoothed, linear...
This oscillator is an enhanced version of the Relative Strength Index (RSI) with a customizable color scheme for overbought and oversold areas.Input Parameters:- Period for Oscilla...
This is the 'Middle-High-Low Moving Average' indicator, which is a correlation of two averages. It is not a single average but a combination of two averages: a regular average and ...
RSI with the option of price smoothing prior to RSI calculation, enabling additional signal filtering.The input parameters include the RSI calculation period and the method for det...
The ALMA (Arnaud Legoux Moving Average) indicator is a powerful tool that smooths out price fluctuations and highlights trends by applying a moving average twice.This enhanced vers...