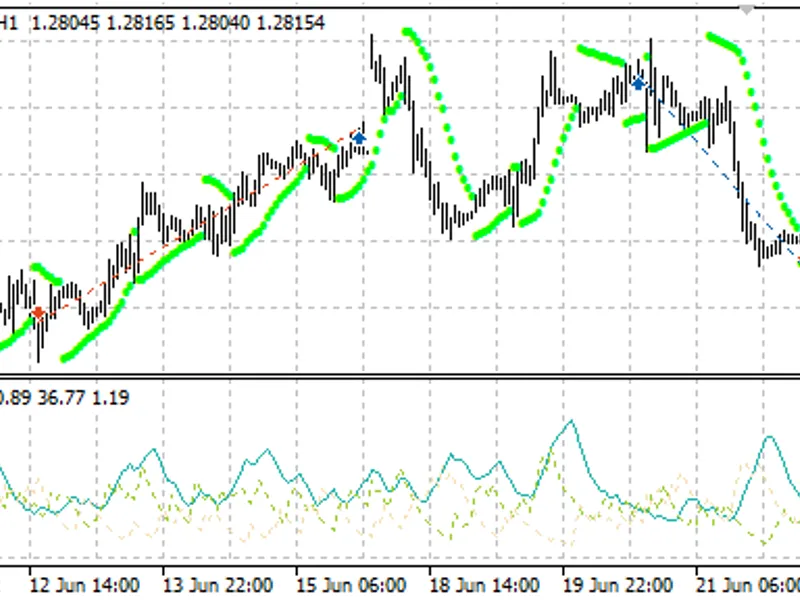
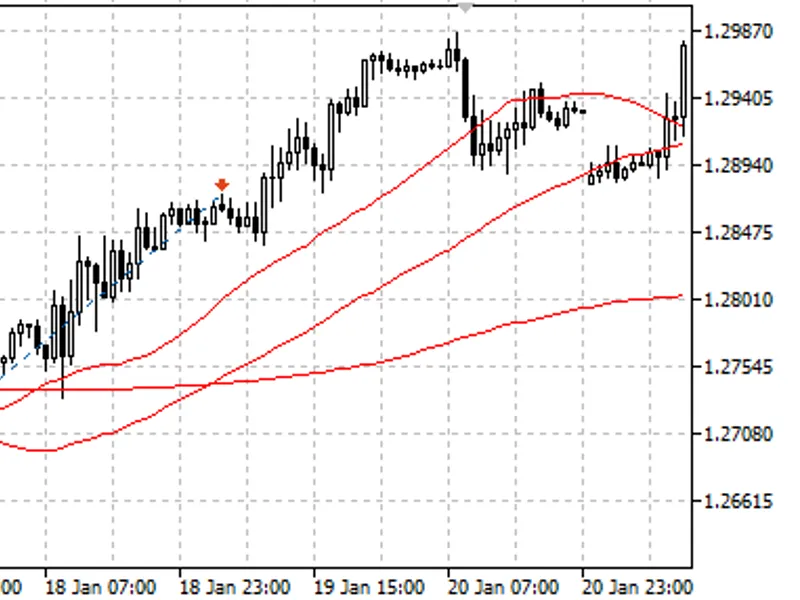
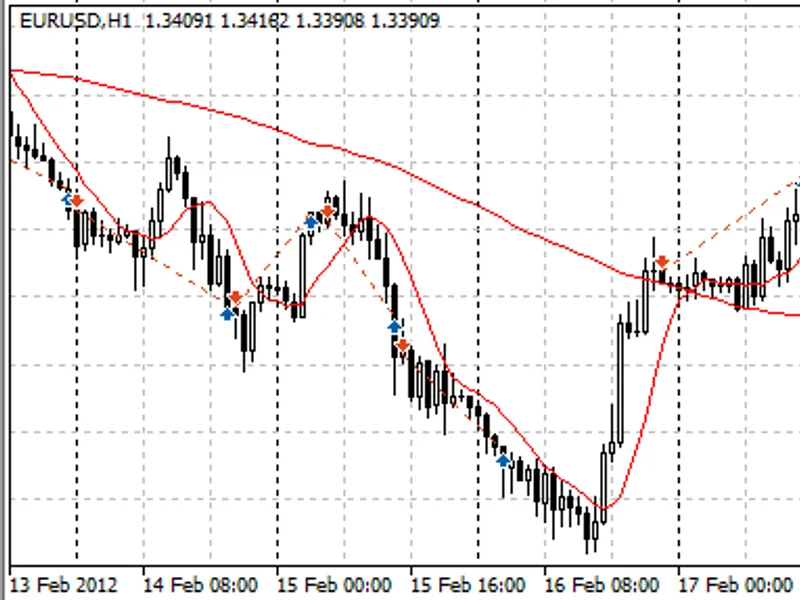
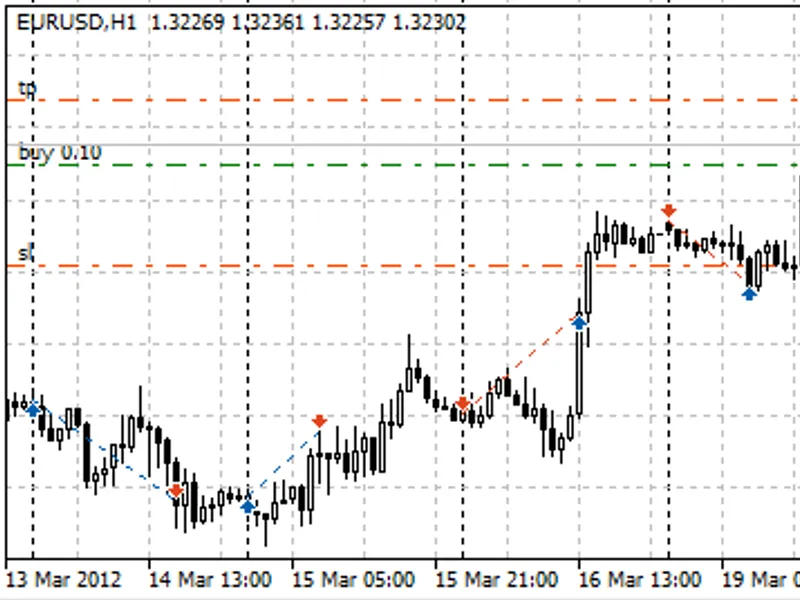
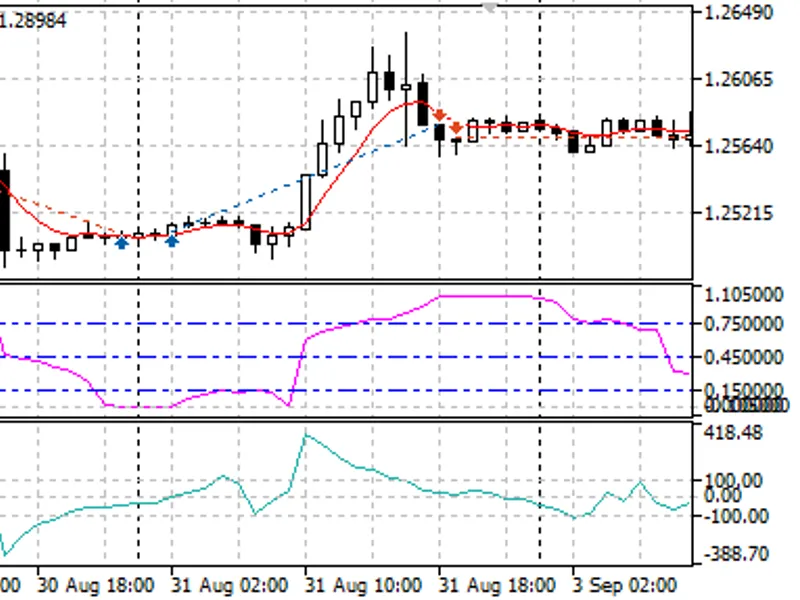
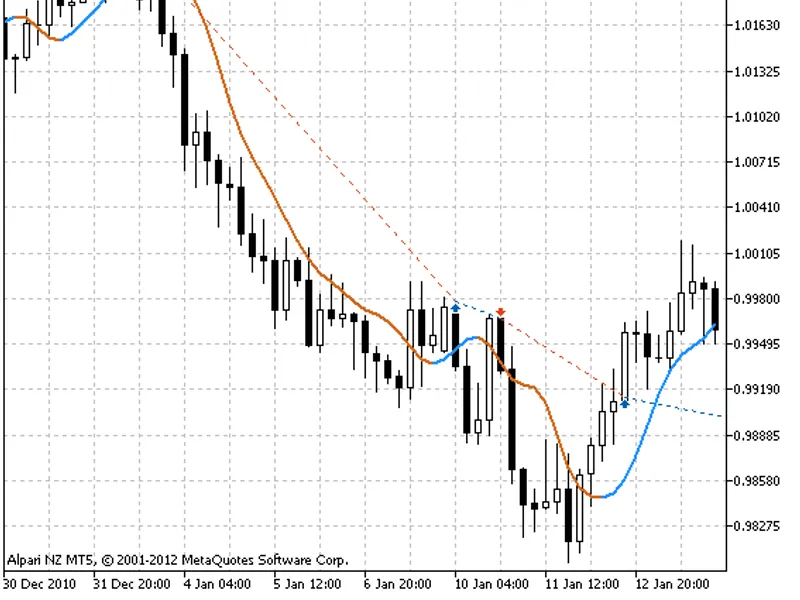
The Gann Multi Trend indicator is a powerful tool based on the article published on mql5.com. This indicator provides valuable insights for traders, offering a comprehensive approa...
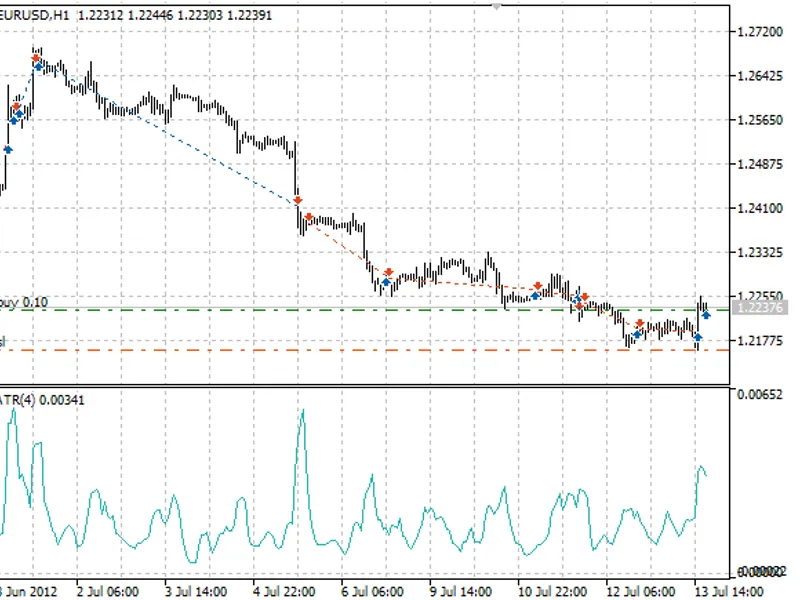
This Expert Advisor (EA) utilizes a price channel strategy for trading, with an emphasis on risk management and position sizing.The EA first establishes a price channel by identify...
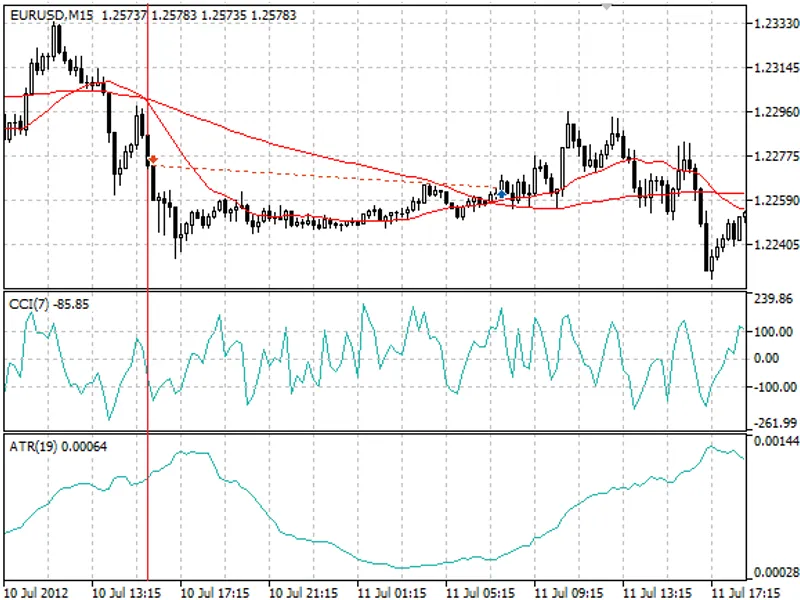
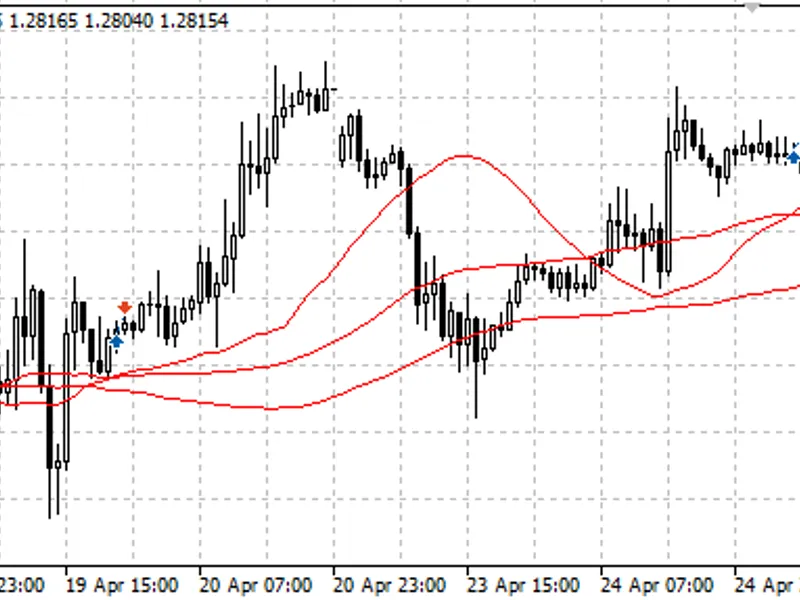
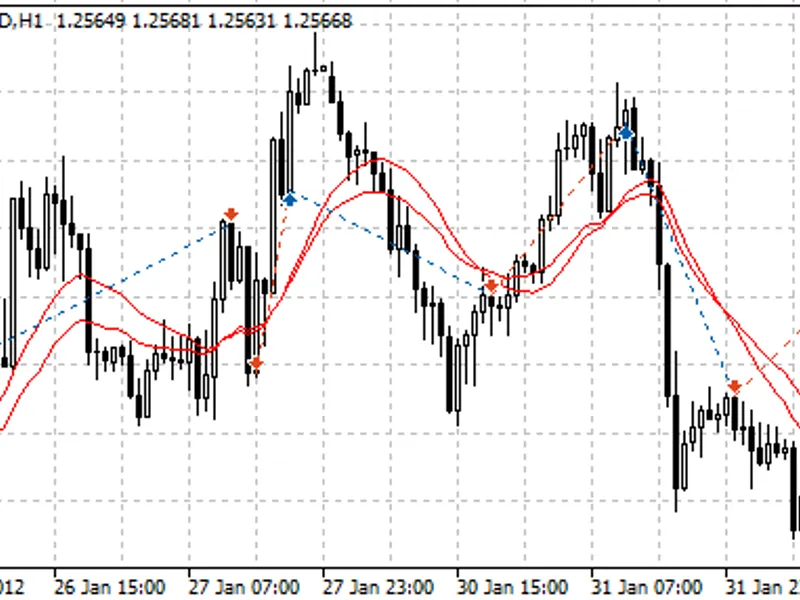
How it works The entry point is determined by the intersection of two moving averages and the concurrent intersection of the zero line by the Commodity Channel Index (CCI). The exi...
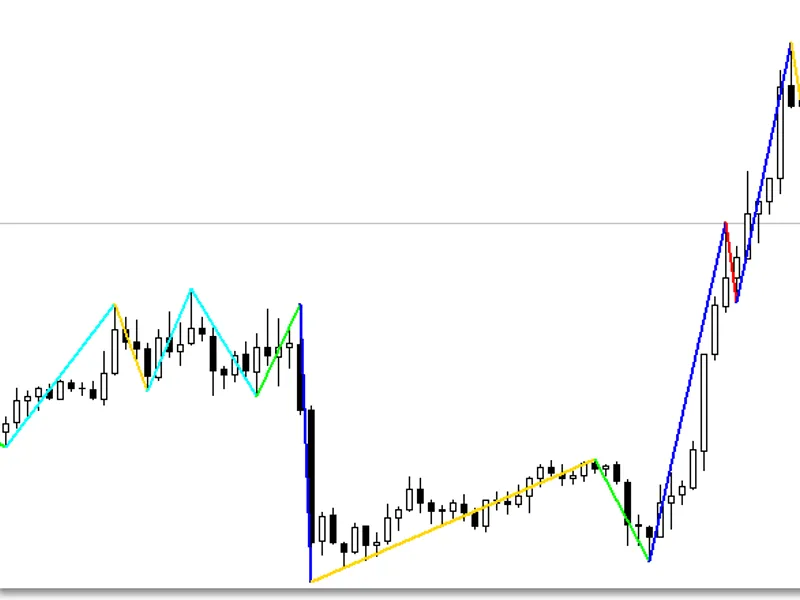
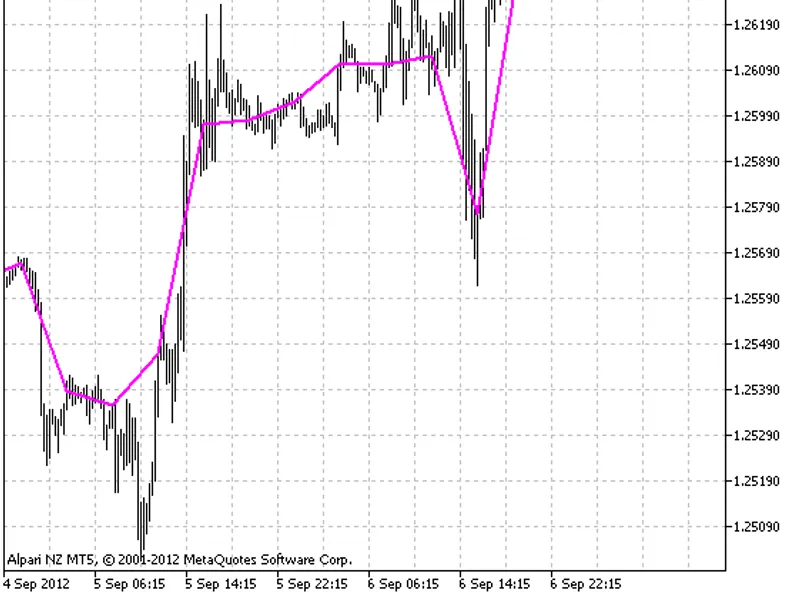
ColorZZ is a modified indicator that visually represents price movements with color-coded segments. It calculates the ratio of the current segment range to the previous segment ran...
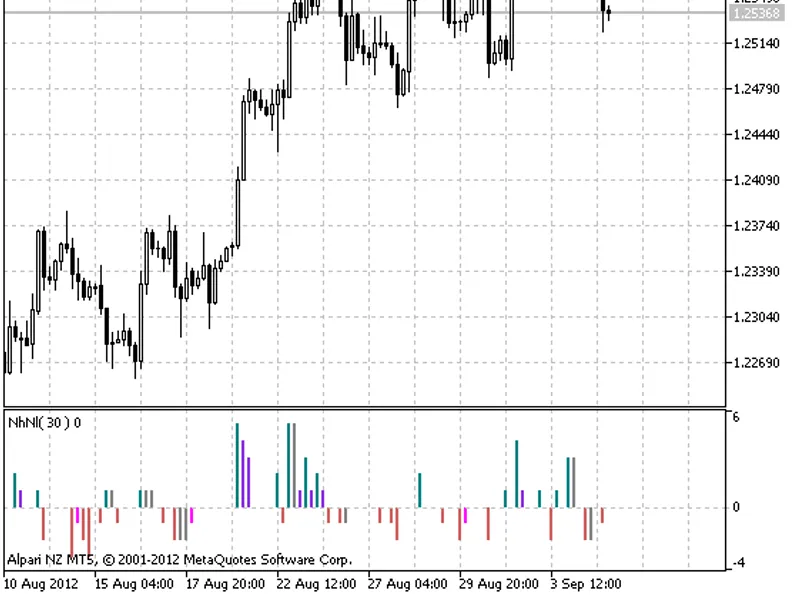
The New Highs-New Lows Index is a powerful tool for traders, as described by A. Elder in the book 'Trading for a Living: Psychology, Trading Tactics, Money Management' (2026).This ...
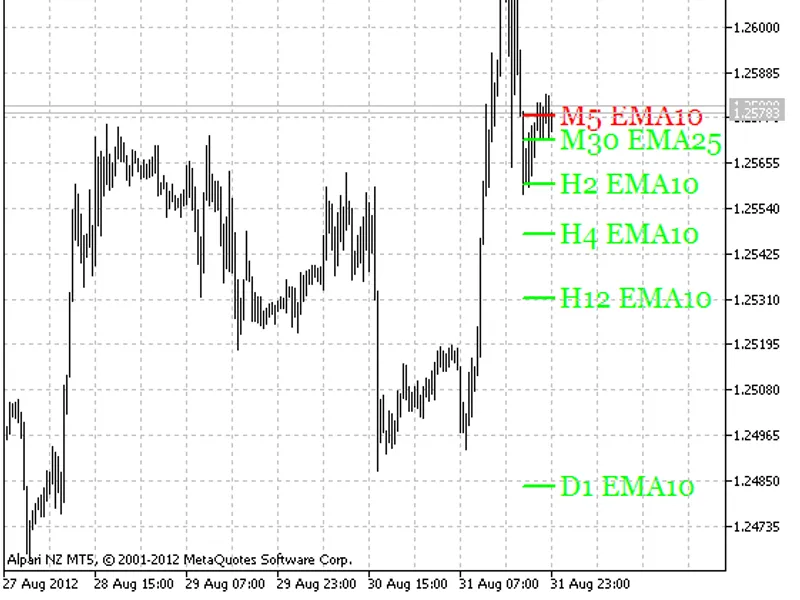
The Multi Line Moving Average indicator displays six moving averages for various time frames on the active chart.Each moving average's parameters are customizable for specific peri...
The incgui_bitpic.mqh include file introduces the cbitpic graphical control class, offering a comprehensive suite of functions for pixel drawing.Fig. 1 showcases a sample drawing c...
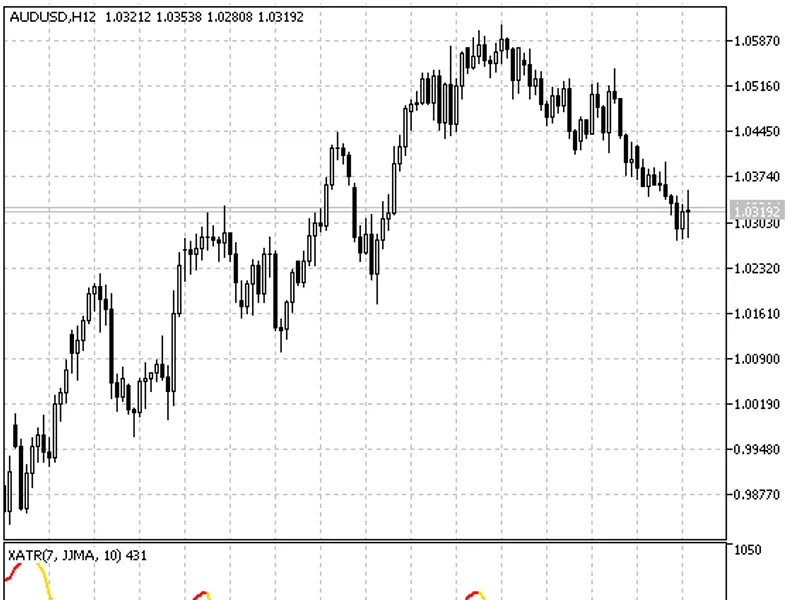
Smoothed ATR, recalculated as price chart points.This indicator uses color to visually represent the strengthening or weakening of a trend. Red indicates a strengthening trend, whi...
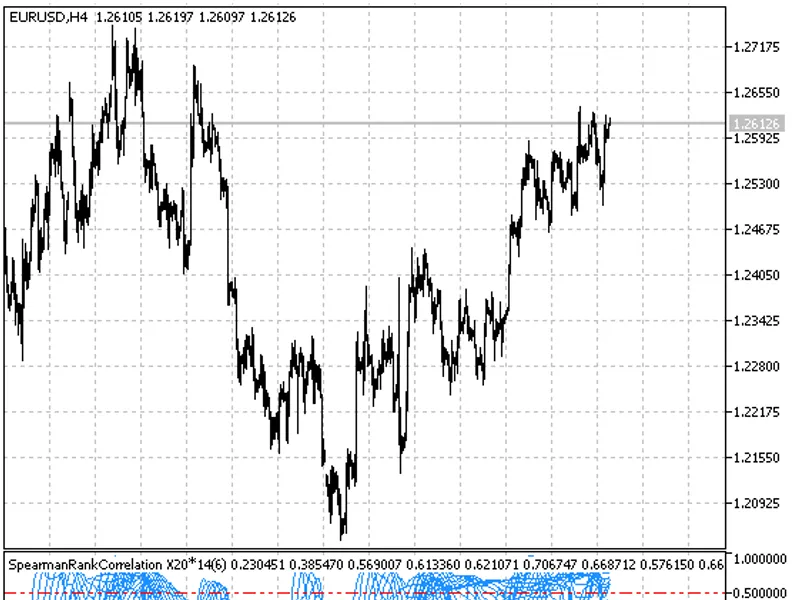
This indicator displays twenty lines of Spearman's indicator in a single window. It was originally implemented in MQL4 and published in the code base in 2026. Image: spearmanstack_...
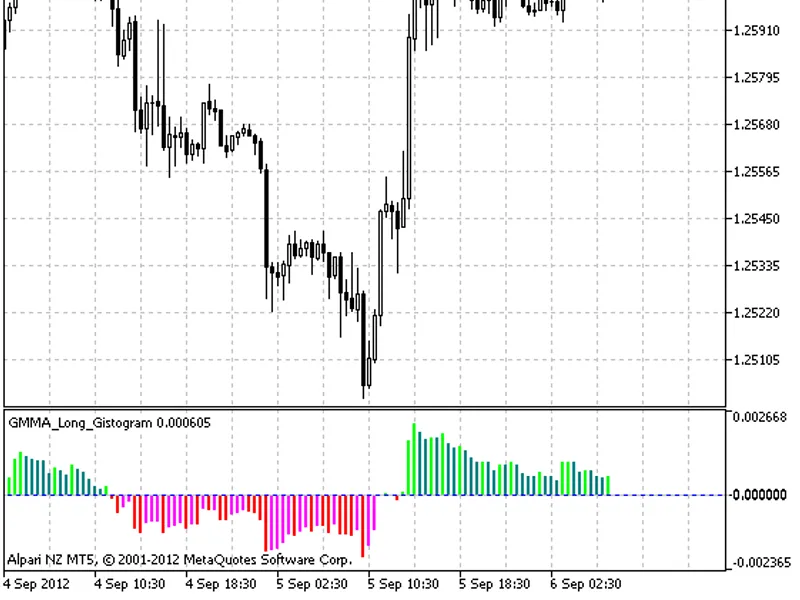
The GMMA Long Gistogram is a trend-following indicator, inspired by the idea of converting the GMMA_Long indicator into a histogram for better visualization.Originally implemented ...
This expert advisor (EA) utilizes pivot points for trading decisions, opening positions based on price interactions with support and resistance levels.A buy position is initiated w...
How it worksThe GPF TC Pivot Stop Expert Advisor calculates the pivot point and three support/resistance levels based on daily bars. It opens a position when the price hits the piv...
The getextremums() function is a powerful tool for identifying extremums within a specified historical period. It employs a search algorithm akin to that used in the indicator, rel...
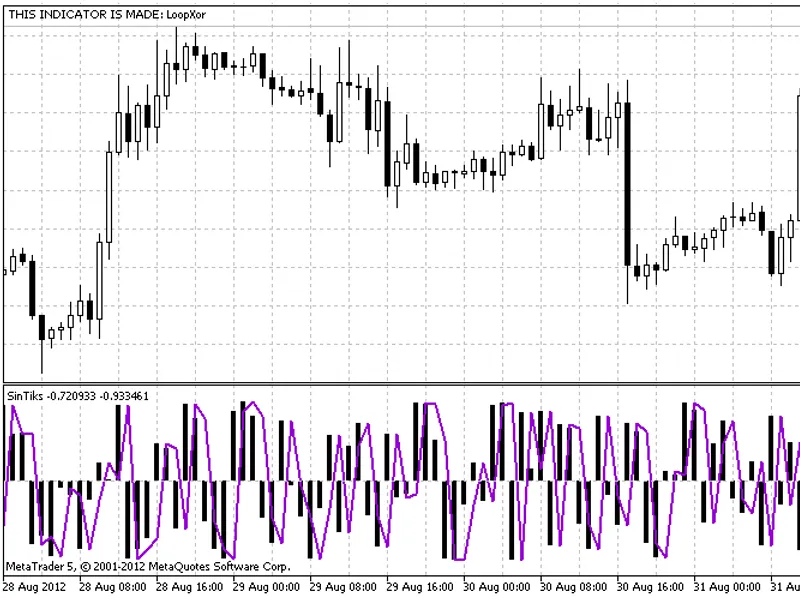
This indicator displays the sine and tick values on your MetaTrader charts.Features:- Sine value: Provides the sine value of the current price.- Tick value: Displays the tick value...
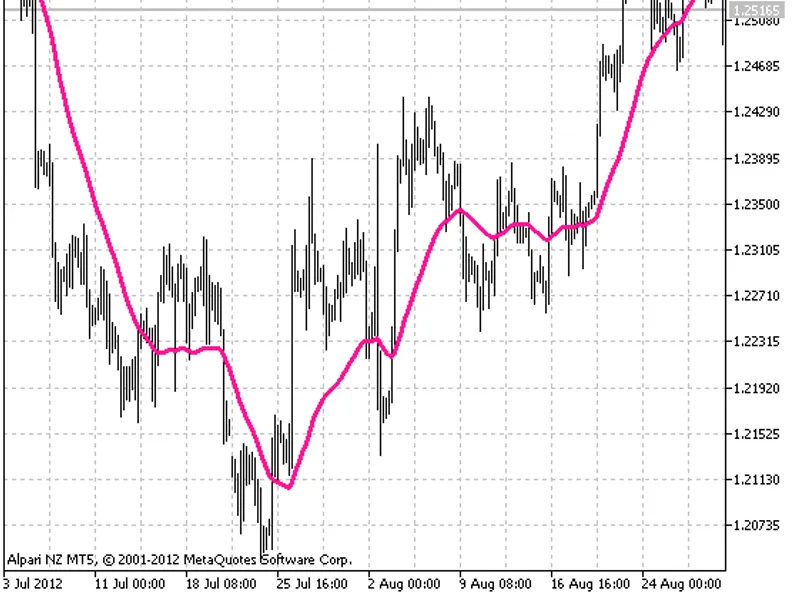
The method was first introduced in the article "Gleitende Durchschnitte 3.0" (2026). This implementation uses λ = 2 for effective lag reduction. Higher λ values increase similarity...
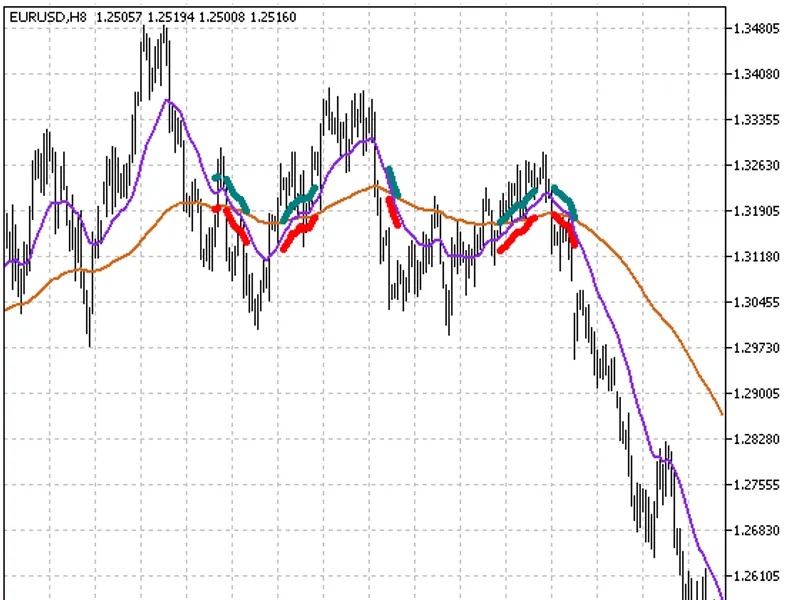
KalenzoThe Squize_MA indicator illustrates the intersection of two moving averages with distinct averaging periods.The chart incorporates traditional flat limits, and a breakout in...
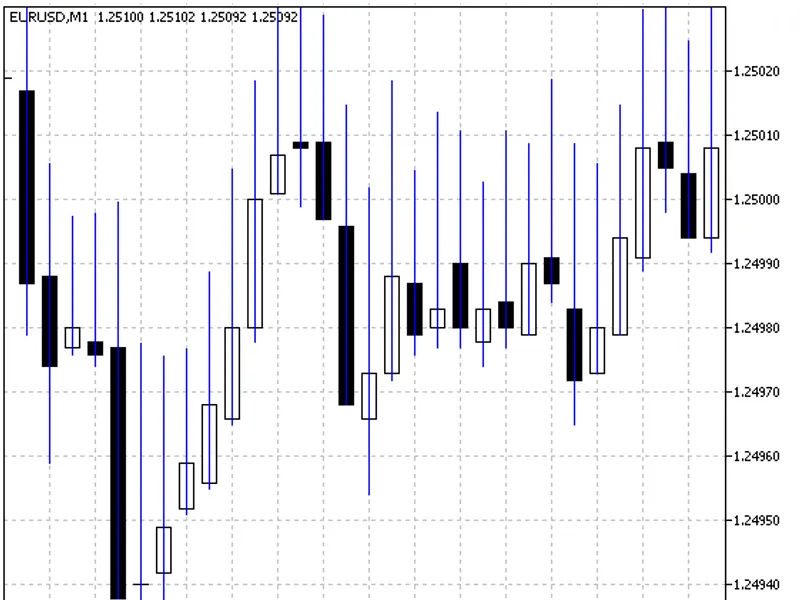
This indicator is designed to enhance your trading experience by visually representing the bid-ask spread on small time frames.When working with limited time frames, the spread val...
The CTradeStatistics class provides a comprehensive suite of enumeration parameter calculations, offering a flexible approach to statistical analysis in trading strategies.With the...
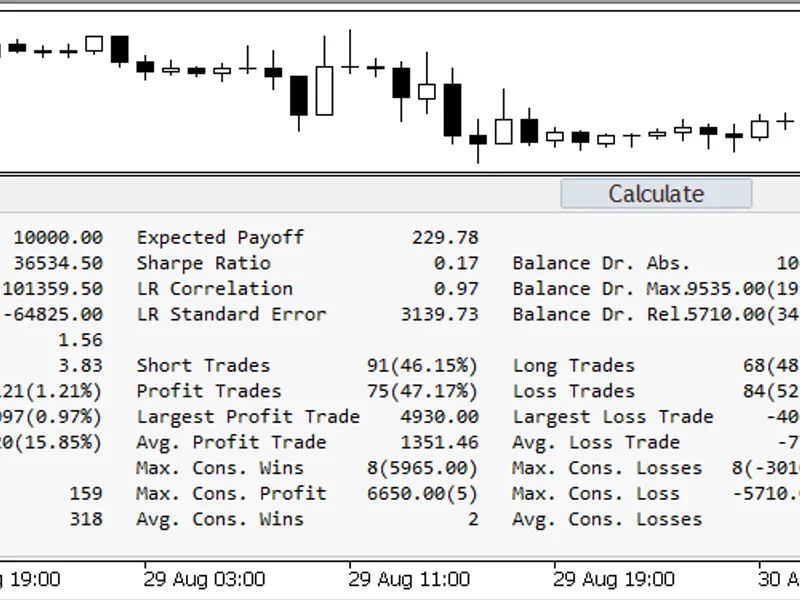
The indicator panel provides a comprehensive overview of your trading performance by displaying key statistical metrics for the current account. These metrics are calculated based ...
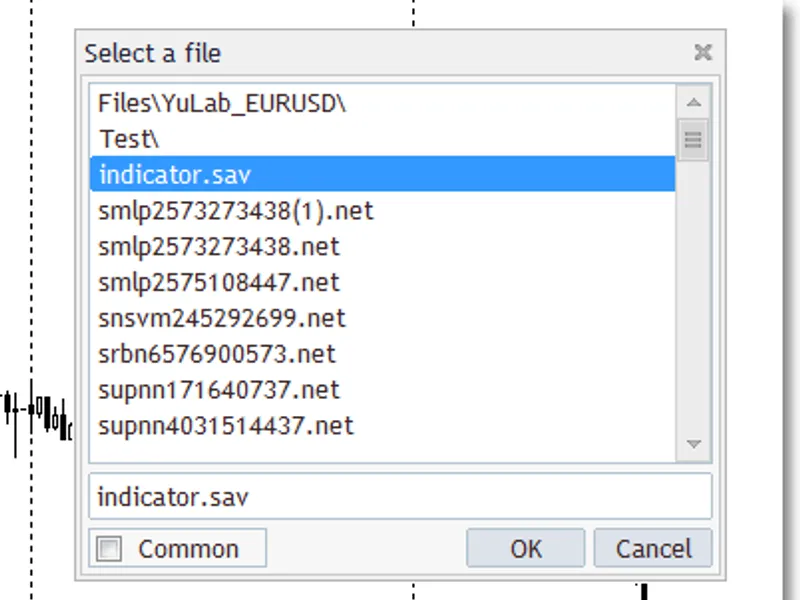
cselectfile is a graphical interface class for file selection, built upon standard library class methods.Methods:- create: Generates a graphical interface.- chartevent: Handles cha...
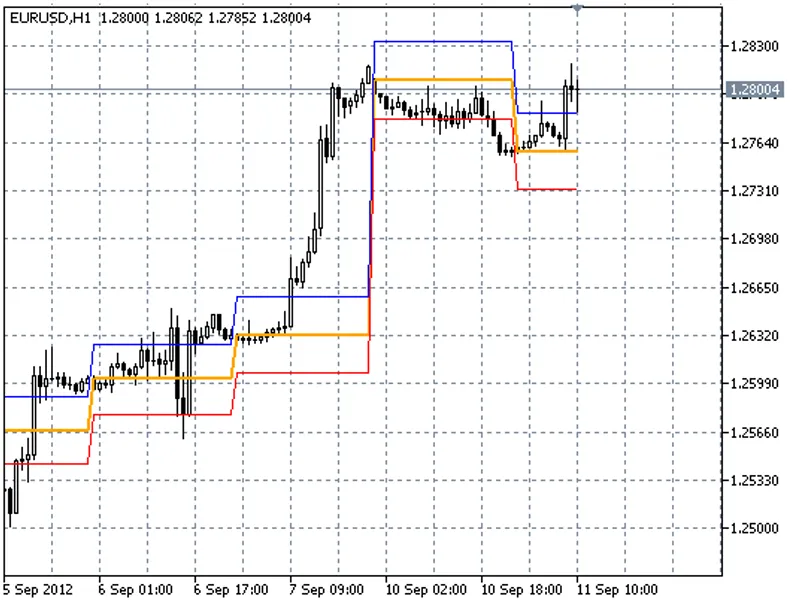
The indicator displays the opening price of the higher time frame (e.g., daily time frame) and creates line indents to the opening price, forming a range.Based on the settings, the...
How it worksThree moving averages are used.Conditions for buying:- The fast moving average crosses the middle moving average upwards.- The fast MA is above the slow MA.- The fast M...
The Expert Advisor (EA) is designed to execute trades based on the change in direction of a moving average (MA). It generates a trading signal when a bar closes, provided the MA di...
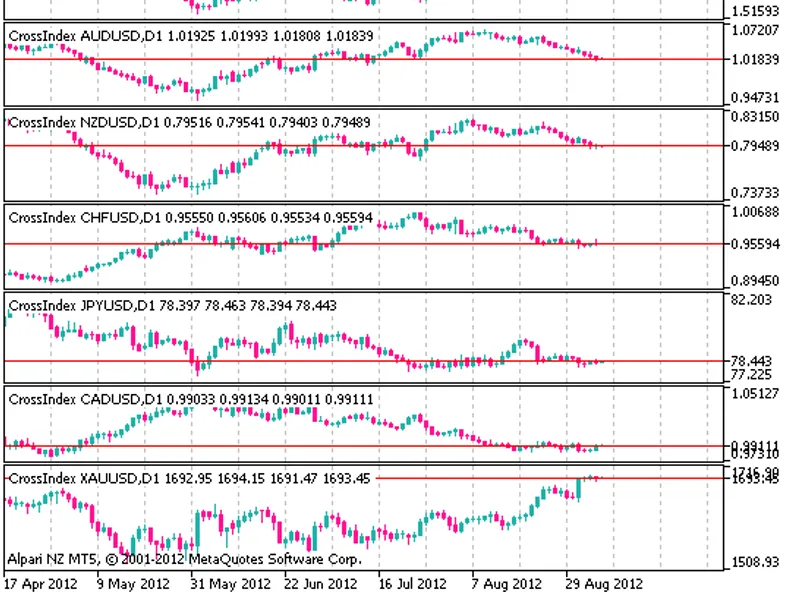
The Multi-Currency Indicator enables the simultaneous analysis of up to eight currency charts. This indicator does not perform calculations but presents eight indicator candlestick...
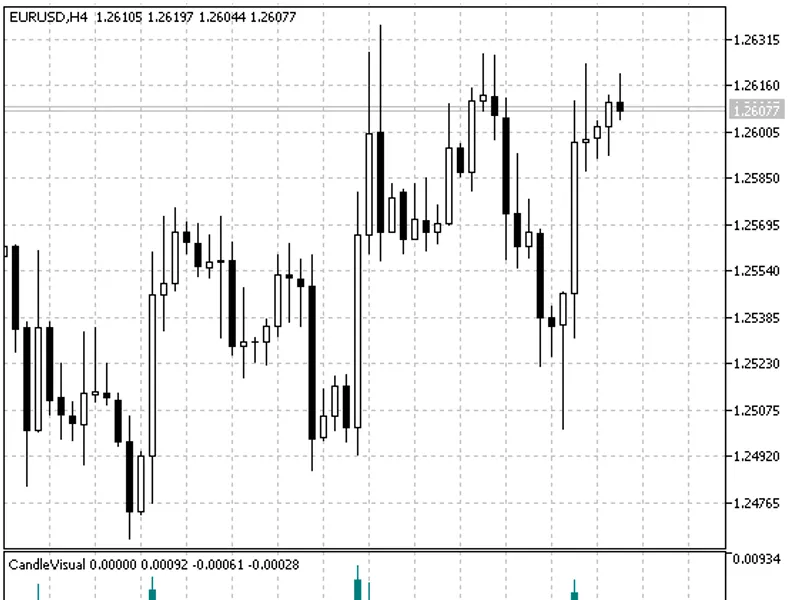
The simplest visual interpretation of a candlestick chart.This indicator was first implemented in MQL4 and published in the code base in 2026.Fig.1 The CandleVisual Indicator...
This Expert Advisor (EA) utilizes a trend-following strategy, capturing market trends for profitable trades.How it WorksThe EA's entry direction is guided by an indicator, with the...
This Expert Advisor (EA) is designed to optimize trading strategies using exponential (EMA) and linear weighted (LWMA) moving averages.How it WorksThe EA opens a buy position when ...
This expert advisor utilizes three moving averages (MAs) for trading signals.When the fast MA crosses the middle MA, and both are below the slow MA, a buy position is opened. Conve...
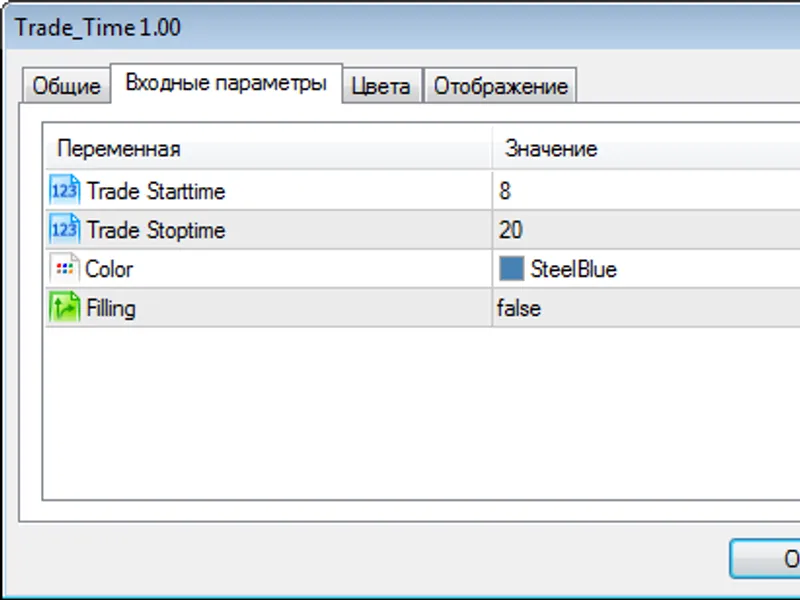
This indicator is designed for intraday manual trading systems that utilize trade start and stop times.It visually represents the trading period by drawing a rectangle, allowing tr...
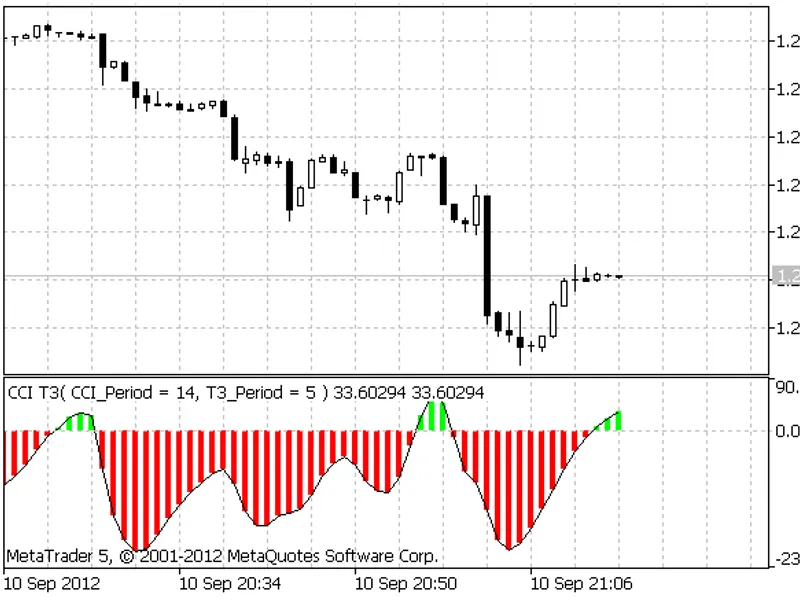
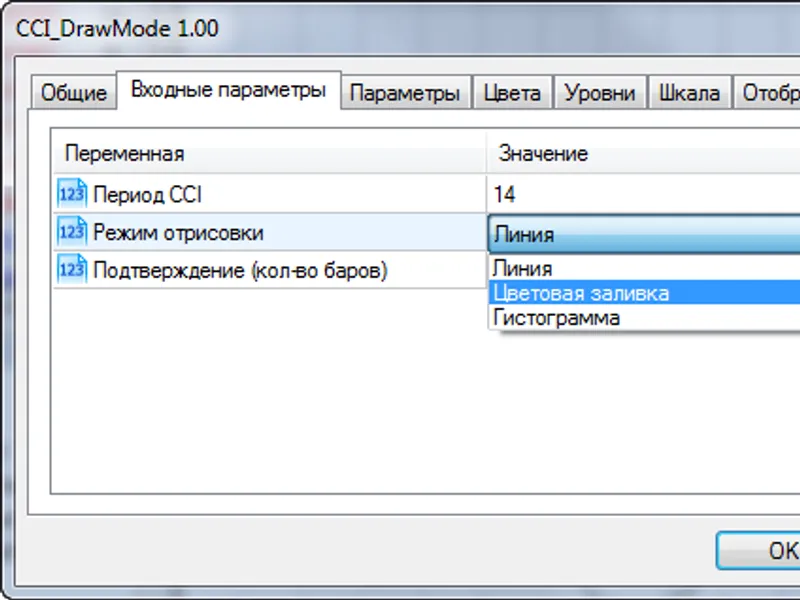
This indicator offers a customizable drawing mode, demonstrated here with the CCI oscillator. The histogram includes a new parameter, 'Confirmation (number of bars)', functioning s...
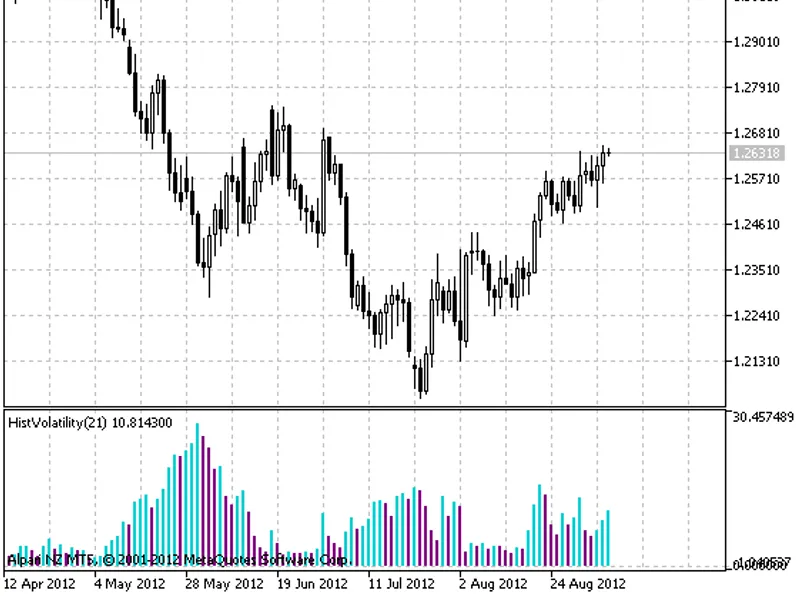
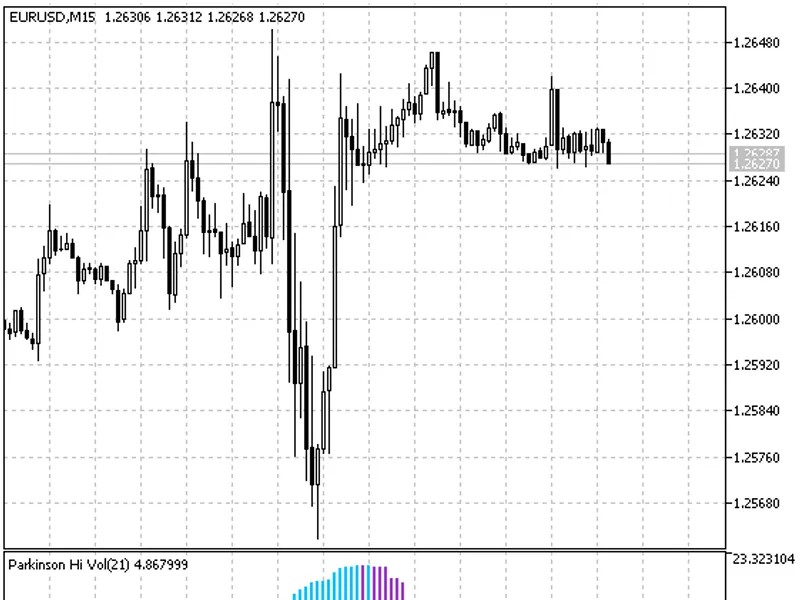
This indicator calculates the historical volatility of a financial asset, providing a measure of the asset's price fluctuations over time.The Parkinson Historical Volatility indica...
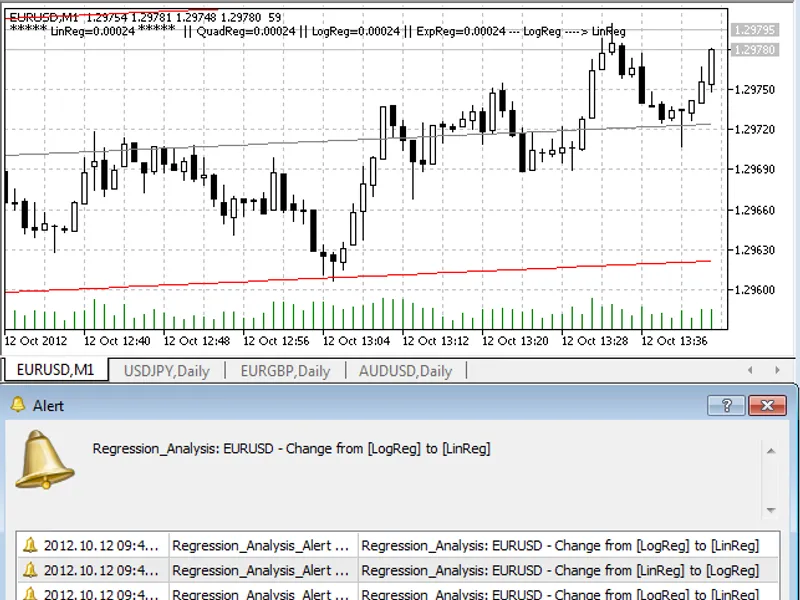
This change alert monitors an indicator that compares four types of regression (linear, quadratic, logarithmic, and exponential) and selects the one that best fits the data.The ind...
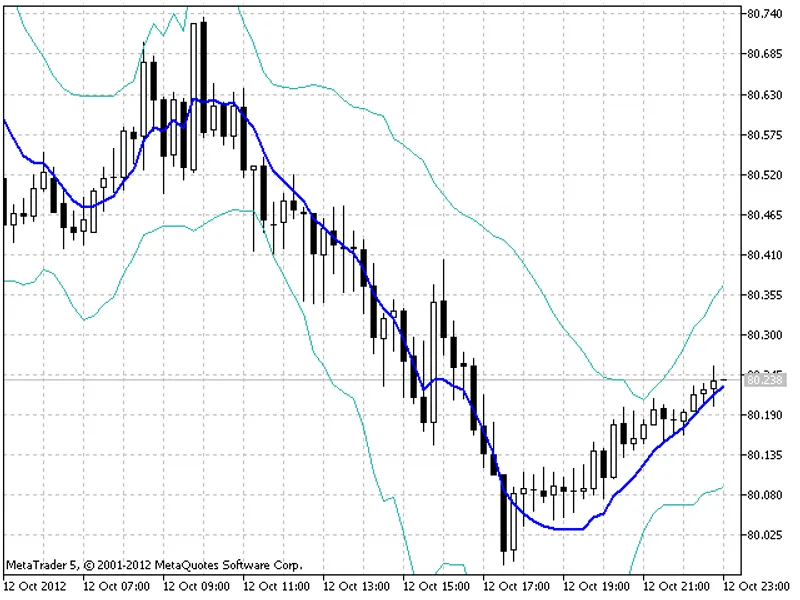
The Triple Exponential Moving Average (TEMA) Band is an indicator inspired by the Bollinger Band. It differs by utilizing the TEMA, resulting in a more symmetrical representation. ...
This Expert Advisor is a powerful trading tool designed to analyze market trends and make informed trading decisions.
How it WorksThe Expert Advisor utilizes a sophisticated strate...
How it works The expert advisor determines the direction of the last daily bar at a set time and opens a position in the opposite direction, provided there is no open position.The ...
The expert advisor's functionality relies on the utilization of a specific indicator.How it WorksThe expert advisor generates signals based on the Laguerre indicator, CCI, and MA. ...
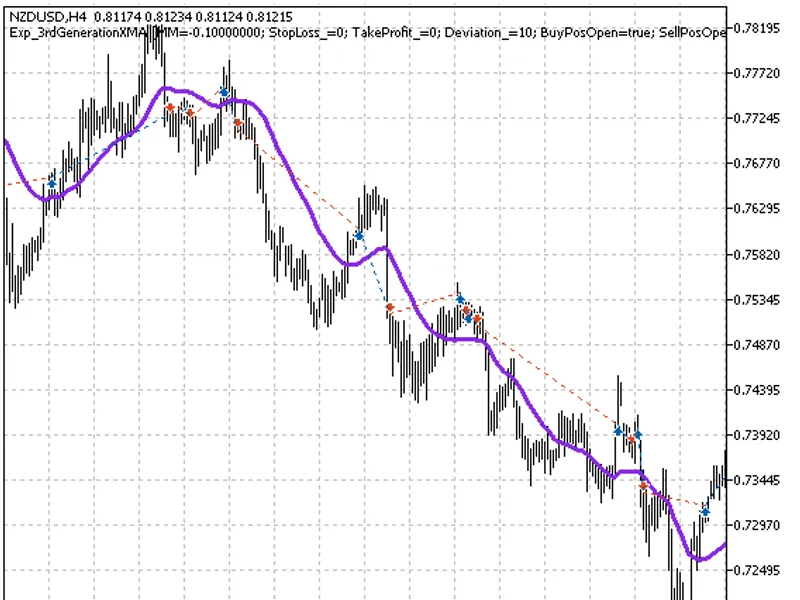
The Exp Bezier Expert Advisor utilizes the change in direction of a universal curve to generate trading signals. When a bar closes and the curve direction changes, a signal is trig...
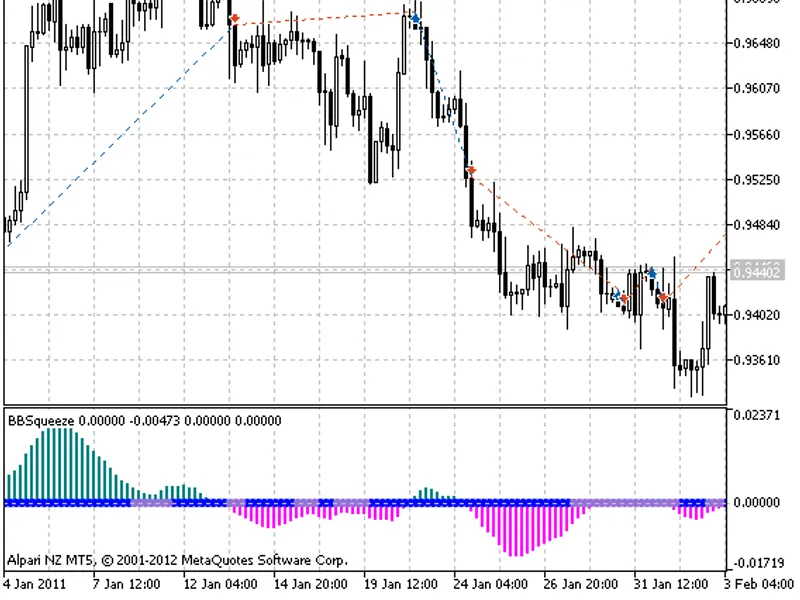
The Exp BB Squeeze Expert Advisor is designed to execute trades based on signals from the BB Squeeze indicator. This indicator generates a trading signal when the histogram color c...
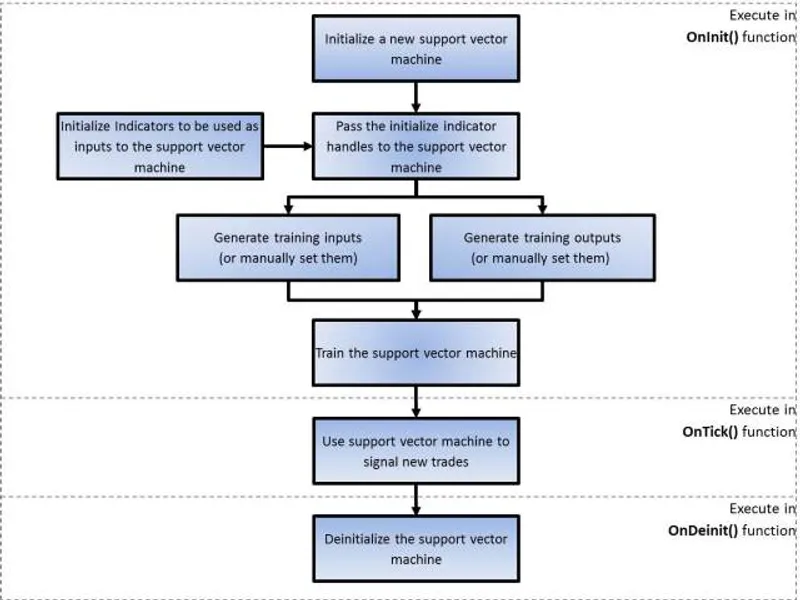
The example Expert Advisor ("SVMTrader") demonstrates the utilization of the Support Vector Machine (SVM) learning tool for trading strategies. This Expert Advisor operates as foll...
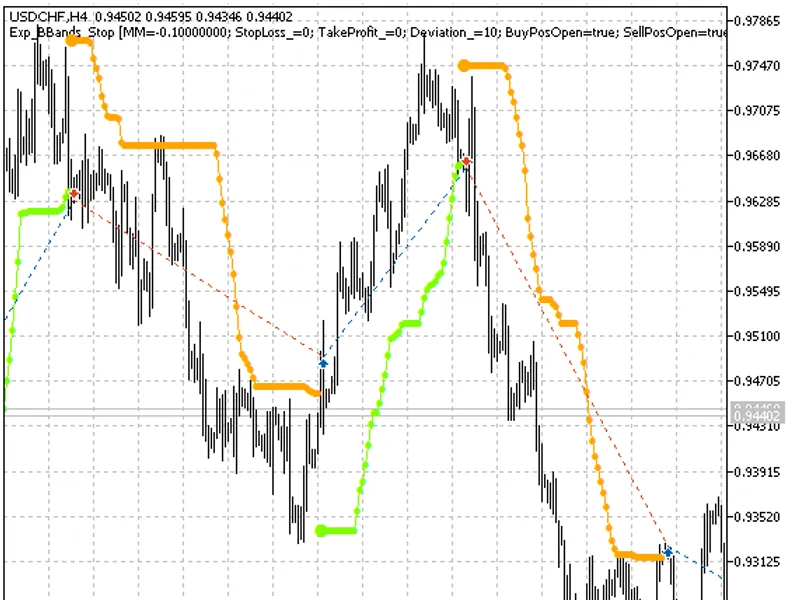
The Exp Bbands Stop Expert Advisor is designed to generate trading signals based on the signals obtained from the indicator. It initiates a trade when a bar closes and the indicato...
The Shapiro-Wilk test is a powerful statistical method to assess normality in data sets.For large datasets (over 100 data points), the traditional tables of coefficients can be cum...
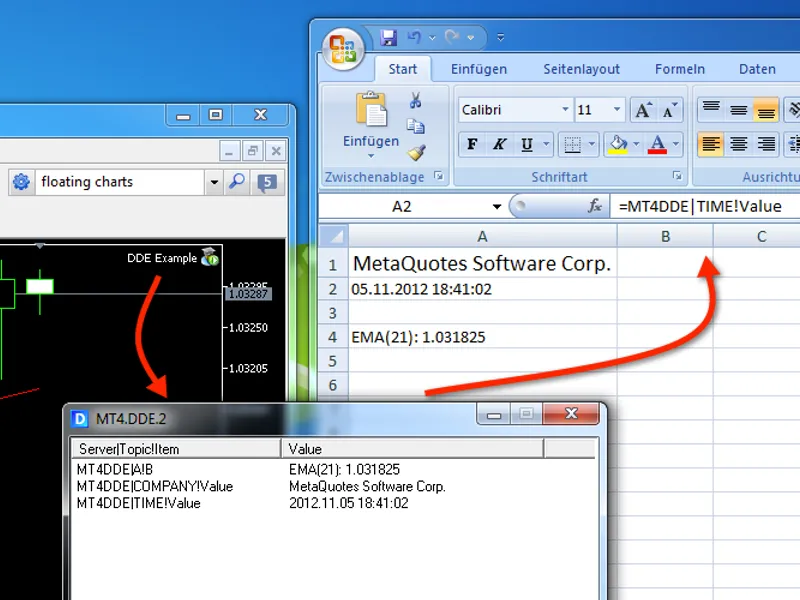
This is a powerful tool designed for MetaTrader 4 (MQL4) and adaptable for MetaTrader 5 (MQL5). It is a lightweight MFC application that serves as a DDE server, enabling the export...