aquarium canvas background this script adds cool colorful live canvas background on the chart like aquarium add canvas_shader.mqh in mql5/include/canvas folder extract files.zip in...
shows symbol name, percentage change of price from last day, and time time has input options, you can select gmt, localtime or tradeservertimeyou can also set label to any corner y...
this script draws fibonacci retracement obj_fibo with options to add your own custom valuesadd custom values seperated by commas and the script will draw fibonacci retracement leve...
averaging-down a double-histogram represents the (green) average positive and (red) averagenegative ma speed, each one averaged-down with a period of # (user input).example:if aver...
this script draws fibonacci fan obj_fibofan with options to add your own custom valuesadd custom values separated by commas and the script will draw fibonacci fan levels with your ...
this script draws fibonacci expansion obj_expansion with options to add your own custom valuesadd custom values separated by commas and the script will draw fibonacci expansion lev...
description measures current bar's moving average speed, in relation to the average of # (averaging period) past bars.this oscillator can be visually described with .calculations c...
risk reward tool calculates risk reward like 1:2 1:3 1:4 and 1:5 just drag and drop script to the chart and your risk reward tool is readyyou can also set custom levels by adding t...
closing partially scriptand stop loss to break even pointinput parameters are as follows.input bool particalclosed=false;input int closedvolume=50;//percentage of lots to close %in...
colored candlestick exemplifying a gradient. it was somewhat hard to find a good working example of draw_color_candles that was understandable, most of the comments were useless, a...
inputs 1 rsi is below value 30 when divergent for buy/bullish divergenceinput 2 divergence settings buysinput 3 lots and stop loss , target in pips. long trades.input 4 rsi is abov...
this is the lightest expert advisor for beginners to learn about market buy sell types and execute it on the strategy tester or live market.this expert advisor will add market, lim...
a collection of useful string manipulation functions immuable strings: all functions in the library will return a modified copy of the source string.the source string is not modifi...
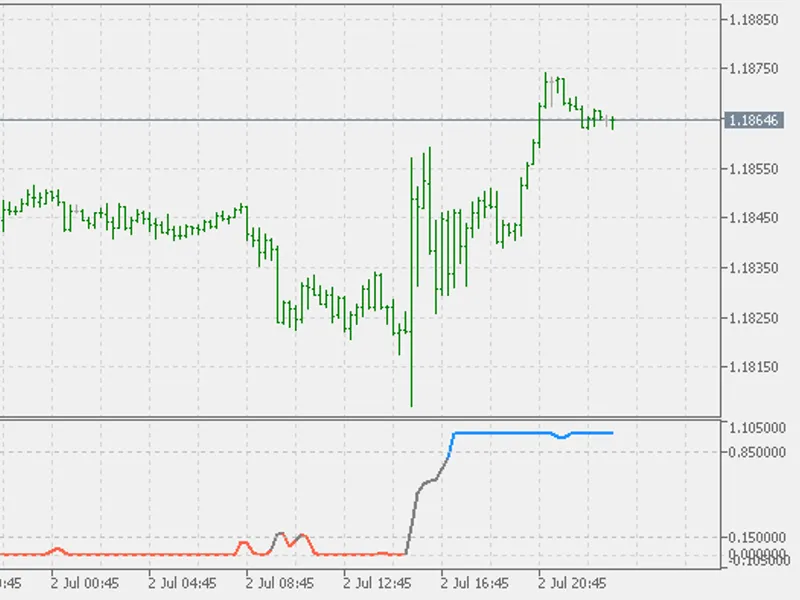
display: red line — upper channel. blue line — lower channel. gray line is a standard donchian channel.settings: channel period — converted to the euclidean distance. volatility ...
update : now it also calculates the commission on "end of test" result on testeri was testing my expert advisor while i found that i have to calculate commission charged by my brok...
buy when the indicator line is green and sell when it is red. when the indicator line is below the horizontal line at the "6" level, the indicator considers the situation as flat. ...
trades amount of pips moved within certain amount of timepre set at 5 pips in 10 seconds .inputs 1&2 are for sells 3&4 buys.inputs lot sizes , target and stop in pips....
trending moving averages with a breakout input .input explanation , i'll explain as a buy trade and sells would be inverse.inp1 20 ema greater than 30emainp2 30 ema greater than 50...
the original of this indicator was posted here : . but, since the metatrader 5 platform is evolving and changing a lot, and since we had enough time to learn some nuances, some opt...
atr calculation is done internally (not using built in atr) smoothing is done using built in averages functions though - simply to allow more smoothing modes recommendations: ...
most volume/volatility take into account price volatility to determine if price is moving or not. however, they usually fail to get you out of choppy price action. this indicator w...
fibonacci retracement high to low monthly, weekly and day.-0.50 to 1.5 all rectrament levels , in different colours.includes script to delete all fibo lines off chart....
this expert advisor opens trades , for buys, sell are inverse.when the williams percent rises and the average directional index di+ di- crosses downcloses trades whenmoney flow ind...
volume colored candlestick with bollinger bands as the standard deviationchangelogv1.02b: hotfix for static int chartbars, where it would be forever the first call value of bars(sy...
expert, trades using awesome oscillator, accelerator oscillator.stochastics can be used as a filter , upper and lower levels.for buy trade main stoch line must be greater than sign...
opens trades when a engulfing bar occurs at the same time as a change in heiken ashi colour opening above moving averages, two rsi filters, set at 5 &14 periods.engulfing bar m...
simple class for getting the number of microseconds (µs) elapsed since january 1, 1970.the error of this method is about 0.5 milliseconds. this is due to the temporal discreteness ...
it happens sometimes when you've been creating and ea and you haven't noticed a bug that causes too many positions if not orders to be opened . or maybe there was a trade execution...
the story behind this trading tool: most traders lose and this is a fact. there are lot of reasons behind their losses, but the main reason in my opinion is that they can't control...
buy when the indicator line is green and sell when it turns red.the fisher transform indicator is an oscillator that helps to identify trend reversals and can be applied to any fin...
this indicator plots fibonacci channel on last swing high low that can be changed from input variable "extdepth"55 is a best parameter which is set by default. it plots a fibonacci...
it can download data once and be removed or update each 1-5-10 minutes. since it is a service, it can always be active in the background without interfering with charts.32912008.08...
the story behind this trading tool: most traders lose and this is a fact. there are lot of reasons behind their losses, but the main reason in my opinion is that they can't control...
after the three average lines are arranged completely according to high and low, it can be regarded as a trend formation. after the pattern is destroyed, the hatching is no longer ...
the highpass-lowpass roofing filter was created by john ehlers (cycle analytics for traders pg.78)this is a variation of a roofing filter that will let you know which direction the...
this expert advisor demonstrates how to create and save graphic charts to a .bmp file from the mt5 strategy tester. the graphic.mqh package (include/graphics/) is used. in mt4 this...
history mode to indicator. set "historymode" parameter to true then "double click" on any point in price chart to see support and resistance zones in that point, is done by mr. beh...
this free code manages to close all open positions complying with fifo rules just by drag and drop into the chart, no matter if profit or loss.must enable autotrading....