Bulls Power
This is a powerful addition to your MetaTrader 5 toolkit designed to optimize market analysis and performance. This technical indicator acts as a specialized analysis tool designed to visualize market data. It helps traders identify emerging trends, momentum shifts, and key support or resistance levels by plotting statistical calculations directly onto price charts.
How to Setup and Use Bulls Power
1. Installation: Place your file in the MQL/Indicators folder via "Open Data Folder" and restart your terminal.
2. Loading: Find the indicator in the Navigator, drag it onto your chart, and configure the input parameters in the popup window.
3. Customization: Press Ctrl+I to open the indicator list, select your tool, and click "Properties" to change colors, levels, or visual styles.
4. Updating: Replace the old file in the Indicators folder with the new version and restart the platform to apply changes.
Frequently Asked Questions
Q: Why is my indicator not showing? A: Verify the file is in the MQL/Indicators folder, or try right-clicking the "Indicators" tree in the Navigator and clicking "Refresh."
Q: Do custom indicators slow down the platform? A: Too many complex indicators can impact performance; remove unused ones via the "Indicator List" (Ctrl+I).
Q: Can I use MT4 indicators on MT5? A: No, MQL4 and MQL5 are distinct languages; ensure the indicator is compiled specifically for your platform version.
Description & Settings
Everyday trading represents a battle of buyers ("Bulls") pushing prices up and sellers ("Bears") pushing prices down. Depending on what party scores off, the day will end with a price that is higher or lower than that of the previous day. Intermediate results, first of all the highest and lowest price, allow to judge about how the battle was developing during the day.
It is very important to be able to estimate the Bulls Power balance since changes in this balance initially signalize about possible trend reversal. This task can be solved using the Bulls Power oscillator developed by Alexander Elder and described in his book "Trading for a Living: Psychology, Trading Tactics, Money Management". Elder based on the following premises when deducing this oscillator:
moving average is a price agreement between sellers and buyers for a certain period of time,
the highest price displays the maximum buyers' power within the day.
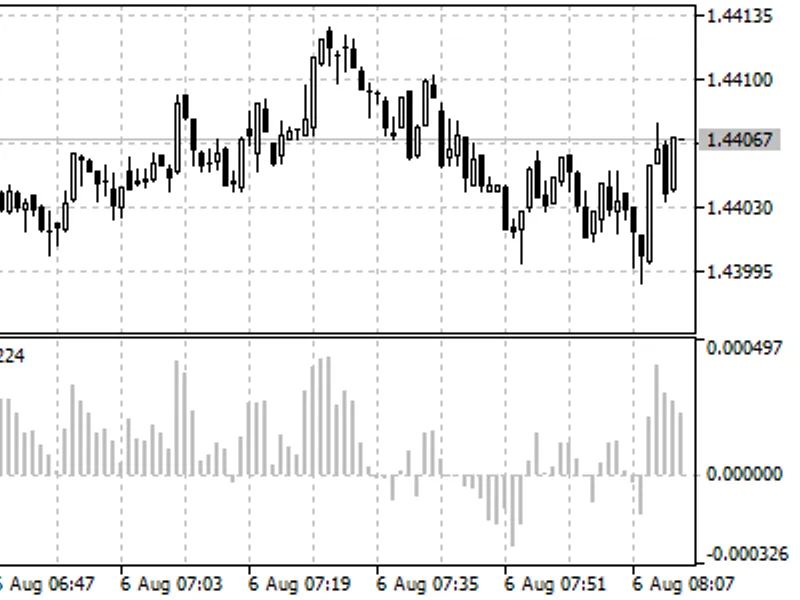
On these premises, Elder developed Bulls Power as the difference between the highest price and 13-period exponential moving average (HIGH - EMA).
Application
This indicator is better to use together with a trend indicator (most frequently Moving Average):
if trend indicator is down-directed and the Bulls Power index is above zero, but falling, it is a signal to sell;
it is desirable that, in this case, the divergence of peaks were being formed in the indicator chart.
Calculation:
The first stage of this indicator calculation is calculation of the exponential moving average (as a rule, it is recommended to use the 13-period EMA).
BULLS = HIGH - EMA
where:
BULLS - Bulls' Power;
HIGH - the highest price of the current bar;
EMA - Exponential Moving Average.
In the up-trend, HIGH is higher than EMA, so the Bulls Power is above zero and histogram is located above zero line. If HIGH falls under EMA when prices fall, the Bulls Power becomes below zero and its histogram falls under zero line.