Gain Loss Info
This professional-grade solution for MetaTrader 5 helps traders achieve greater efficiency in their daily workflow. This technical indicator acts as a specialized analysis tool designed to visualize market data. It helps traders identify emerging trends, momentum shifts, and key support or resistance levels by plotting statistical calculations directly onto price charts.
How to Setup and Use Gain Loss Info
1. Installation: Place your file in the MQL/Indicators folder via "Open Data Folder" and restart your terminal.
2. Loading: Find the indicator in the Navigator, drag it onto your chart, and configure the input parameters in the popup window.
3. Customization: Press Ctrl+I to open the indicator list, select your tool, and click "Properties" to change colors, levels, or visual styles.
4. Updating: Replace the old file in the Indicators folder with the new version and restart the platform to apply changes.
Frequently Asked Questions
Q: Why is my indicator not showing? A: Verify the file is in the MQL/Indicators folder, or try right-clicking the "Indicators" tree in the Navigator and clicking "Refresh."
Q: Do custom indicators slow down the platform? A: Too many complex indicators can impact performance; remove unused ones via the "Indicator List" (Ctrl+I).
Q: Can I use MT4 indicators on MT5? A: No, MQL4 and MQL5 are distinct languages; ensure the indicator is compiled specifically for your platform version.
Description & Settings
Andriy Moraru
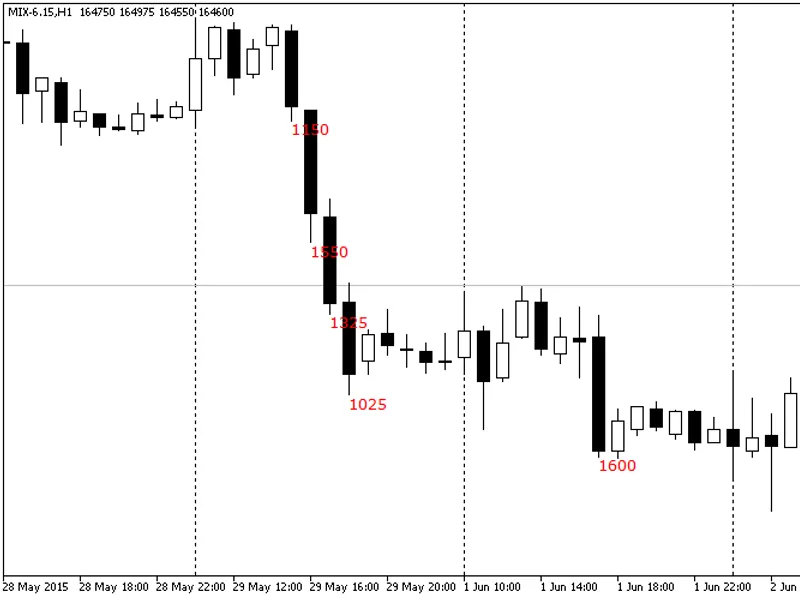
Shows current gain and loss for all candlesticks exceeding the specified threshold. Values are calculated in percentage and points.
The indicator can calculate gain/loss in two modes: simple difference between Open and Close prices, difference between current Close and previous Close. The user can set minimum threshold (in points and percent), change the calculation mode and control the font color for displayed values.
Input parameters:
PercentageLimit
(by default = 1.0) — threshold for displaying the change in percentage points.
PipsLimit
(by default = 1000) — threshold for displaying the change in broker points.
CloseToClose
(by default = true) — if true, the indicator will compare the current Close price with the previous Close price, if false — with the current Open price.
DisplayLossColor
(by default = Red) — color for negative changes (losses).
DisplayGainColor
(by default = Green) — color for positive changes (gains).
DisplayDistance
(by default = 100) — distance from the Maximum price of a candlestick to the displayed gain/loss value in broker points.
MaxBars
(by default = 100) — maximum number of bars to process. The higher this value, the slower the indicator will work.
Tips:
It is almost impossible to use this indicator for getting trade signals. It's mainly intended to simplify the market analysis and to make it easier to find certain bullish or bearish patterns. Of course, everyone can try to use abnormally big changes as signals to open or close positions.