


History Dump CS V with heat map for Excel analysis
Info
The History Dump CS V with heat map for Excel analysis is a Script for MetaTrader 4 that do you need to know at what times of the day you are winning or losing compared to other times or the day. This script creates a.
Usage
This tool is typically used for enhancing chart analysis and decision making.
Platform
This Script works exclusively on MetaTrader 4 (both build 600+ and newer versions).
Setup
Place the downloaded file in MQL4/Scripts folder via File ? Open Data Folder in MetaTrader 4.
How to Install and Use History Dump CS V with heat map for Excel analysis
1. Installation: Move your script file into the MQL/Scripts directory and restart the platform.
2. Execution: Drag the script onto a chart; it will perform a one-time action, such as closing all open orders or clearing chart objects.
3. Editing: Use MetaEditor (F4) to modify code, click "Compile," and verify no errors appear in the terminal before running.
4. Removing: Scripts stop automatically, but you can remove them manually by right-clicking the chart and choosing "Remove Script."
Frequently Asked Questions
Q: How are scripts different from EAs? A: Scripts execute a single action and then stop; EAs monitor the market and trade continuously.
Q: Can I assign a hotkey to a script? A: Yes, right-click the script in the Navigator, select "Set Hotkey," and define your preferred keyboard shortcut.
Q: Why did my script stop? A: Scripts are designed to stop immediately after finishing their programmed command; this is normal behavior.
What this tool does
Do you need to know at what times of the day you are winning or losing compared to other times or the day.
Typical Use Case
This Script excels in automated trading and technical analysis on MetaTrader 4.
Compatible Platform & Setup
This Script works on MetaTrader 4. Place the file in the MQL4/Scripts folder and restart the terminal.
Description & Settings
Related: History analysis on presence of holes and gaps - another powerful script for MetaTrader 4 traders.
Do you need to know at what times of the day you are winning or losing compared to other times or the day? This script creates a .CSV file of your order history so you can import it into Excel and analyse it.
Also recommended: History Draw - similar script with strong performance on MetaTrader 4.
It extracts all order information. Date / time information in both native MetaTrader format (fields ending _MT) and Excel format.It also supports aggregate analysis by calculating a 'Heat map' day and time slot. Days are 0-6 and slots are 0-95.
The heat map default is 4 slots per hour, i.e. 15 minutes, giving you 96 slots per 24 hours. This means trades within that same slot will have the same slot number. This can make your Excel analysis and creation of useful pivot tables a lot easier.
The script saves the output file in the <terminal_data_folder>/MQL4/Files directory. It will also upload the file to your specified FTP server, if you have defined one in your terminal.
Beware that if you have filtered your account history to, say, the last 3 months, then this is all the data that will be extracted. If you want ALL your history, then remove your history filter.
A Little Documentation:
All the available MT4 trading attributes are collected from the available history and output to the CSV file.
In addition, some calculated values are output as well. These are:
Sequence Number. Used to keep the data in order or to re-sort it back into order.
NetProfit. This is Profit less costs, i.e. NetProfit = Profit - Swap - Commission.
Type. Transaction type, e.g. "OP_SELL", "OP_BUYSTOP" etc. Better than a type number.
PriceMove. Differential from OpenPrice to ClosePrice.
Points. Points value for the trade, as per the broker and pair/Symbol.
Pips. Points value for the trade, as per the broker and pair/Symbol.
PotentialWinPips. Pips value of the TakeProfit level (if defined) to the Open level. Typically positive values unless TP was moved to worse-than-entry level before the trade closed.
PotentialLossPips. Pips value of the StopLoss level (if defined) to the Open level. Typically negative values unless SL was moved to better-than-entry level before the trade closed.
DurationMins. The number of minutes from the open time to the close time. Hint: There are 1440 minutes in a day.
HeatMapOpenDay. The day number from 0 to 6 of the transaction open. 0=Sunday. Allows you to drill down by day of the week for opening a trade.
HeatMapOpenSlot. The slot number from 0 to 95 of the transaction open. 0=midnight, each increment represents 15 minutes. Allows you to drill down by the quarter hour for opening a trade.
HeatMapOpenHour. The hour number from 0 to 23 of the transaction open. 0=midnight, each increment represents 1 hour. Allows you to drill down by the hour of the day for opening a trade.
HeatMapCloseDay. The day number from 0 to 6 of the transaction close. 0=Sunday. Allows you to drill down by day of the week for closing a trade.
HeatMapCloseSlot. The slot number from 0 to 95 of the transaction close. 0=midnight, each increment represents 15 minutes. Allows you to drill down by the quarter hour for closing a trade.
HeatMapCloseHour. The hour number from 0 to 23 of the transaction close. 0=midnight, each increment represents 1 hour. Allows you to drill down by the hour of the day for closing a trade.
Use the trading attributes and calculated values in your Excel pivot reports to help you better understand your trading profile and therefore learn ways to optimise it.
The data is appropriate for 4 and 5 digit brokers and uses the correct point and digits values for each pair being analysed.
Times are as per the broker's server, so take this into account when comparing data from brokers in different timezones.
The script is designed to be self contained and not ask for confirmation. If you need to customise it then there is a section below that identifes 4 most likely customisations you may want:
string reportfilename=StringConcatenate("HistoryDumpCSV_",AccountID,".CSV"); // the FileOpen has the FILE_COMMON flag meaning it is saved to the Commong/Files folder.
uchar DELIM='\t'; // Delimiter is '\t' tab. Other options are ';' semicolon and ',' comma. The '\t' delimiter is the default for Excel CSV imports.
int SLOTSPERHOUR=4; // This divides the trading time into 15 minute slots for aggregating data. 2=30 minutes, 3=20 minutes, 1=1hour slots.
bool SendFileByFTP=true; // If not needed, set this to false.
Adjust these to suit your needs.
The script includes FTP functionality so that the report file generated is also sent by FTP to the configured directory on the remote FTP server.
In my case, this is a central NAS drive that holds all my reporting data for all my demo accounts. This allows me to run multiple MT4 terminals on any PC but collect the report data from a single place.
Images:
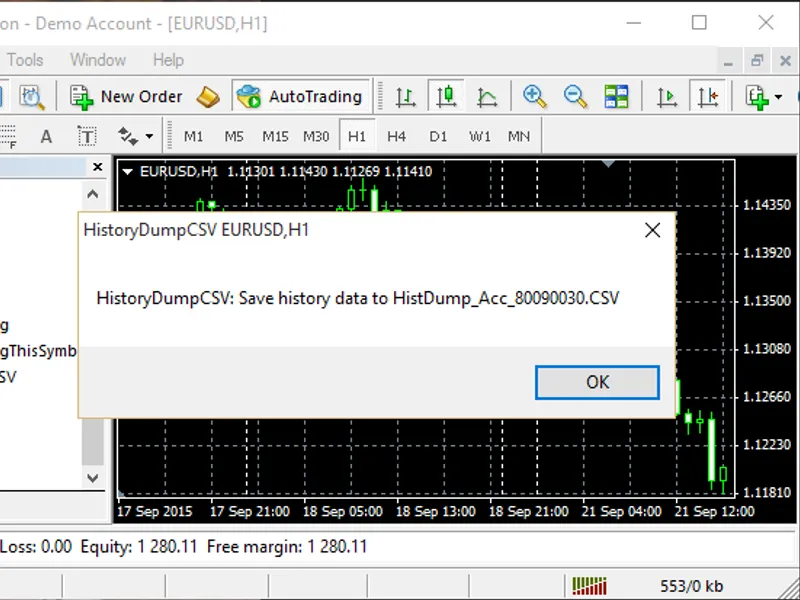
Drag the script onto any chart to initiate it. The script confirms the file generated:
You can then locate the file and analyse as you require.
If you want to use Excel and create pivot reports, then the text has to be converted to columns first:
Converted to columns makes it usable in Excel:
Pivot reports and graphs of your history are now possible:
Use the Insert Pivot wizard:
Select your desired data attributes to create any report:
The full set of screen shots for the transformation of the .CSV file into an Excel pivot report is attached in the .zip file.
You may also like: Grouping account history - excellent alternative for script users on MetaTrader 4.
⚠ Limitations & Risk Warning
- This tool is provided for educational and testing purposes only.
- Past performance does not guarantee future results.
- Trading involves substantial risk of loss. Use on a demo account first.
- Results may vary depending on market conditions, broker, and settings.
- We recommend thorough backtesting and forward testing before using with real funds.