SRm Cloud
This professional-grade solution for MetaTrader 5 helps traders achieve greater efficiency in their daily workflow. This technical indicator acts as a specialized analysis tool designed to visualize market data. It helps traders identify emerging trends, momentum shifts, and key support or resistance levels by plotting statistical calculations directly onto price charts.
How to Setup and Use SRm Cloud
1. Installation: Place your file in the MQL/Indicators folder via "Open Data Folder" and restart your terminal.
2. Loading: Find the indicator in the Navigator, drag it onto your chart, and configure the input parameters in the popup window.
3. Customization: Press Ctrl+I to open the indicator list, select your tool, and click "Properties" to change colors, levels, or visual styles.
4. Updating: Replace the old file in the Indicators folder with the new version and restart the platform to apply changes.
Frequently Asked Questions
Q: Why is my indicator not showing? A: Verify the file is in the MQL/Indicators folder, or try right-clicking the "Indicators" tree in the Navigator and clicking "Refresh."
Q: Do custom indicators slow down the platform? A: Too many complex indicators can impact performance; remove unused ones via the "Indicator List" (Ctrl+I).
Q: Can I use MT4 indicators on MT5? A: No, MQL4 and MQL5 are distinct languages; ensure the indicator is compiled specifically for your platform version.
Description & Settings
HgCl2
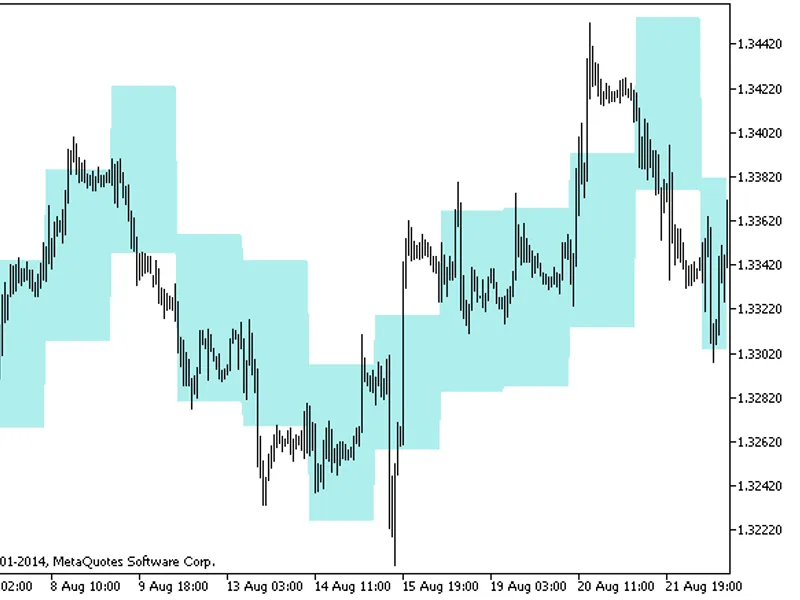
The indicator utilizes the idea of adding to a bar open time the value equal to the average minimum swing from the open price for a few days or weeks, and the standard deviation from the average swing multiplied by a coefficient to determine the possible resistance level. It's vice versa for the support level.
The minimum swing relative to the open price of a day or week is the lowest of the distances High - Open and Open - Low.
Resistance level of the indicator is:
R = Open - k * AV - k_std * Std;
where:
AV is the average minimum swing from the open price for a few days;
k - coefficient of the average minimum swing;
Std - standard deviation from this minimum swing;
k_std - multiplier coefficient. (is available in the indicator settings).
For the support level:
S = Open + k * AV + k_std * Std;
In contrast to the methods of finding support and resistance levels using GSV ('Long-Term Secretes to Short-Term Trading' by Larry Williams, chapter: 'Greatest Swing Value'), all minimum swings of 4 and 9-day or week bars are used in calculation without separating divergent bars.
The mean swing value and its standard deviation are calculated separately for the period defined in the input parameters, and at the end of calculation the indicator selects the largest sum of the average swing and standard deviation multiplied by the coefficient. This ratio can be modified in the indicator settings window (the default is one, which means that one standard deviation is added to the mean minimal swing as a filter).
The original indicator was developed in the MQL4 language and published in the on 26.08.2013.
Figure 1. The SRm_Cloud indicator