VR---FIG U R A
This is a powerful addition to your MetaTrader 4 toolkit designed to optimize market analysis and performance. This technical indicator acts as a specialized analysis tool designed to visualize market data. It helps traders identify emerging trends, momentum shifts, and key support or resistance levels by plotting statistical calculations directly onto price charts.
How to Setup and Use VR---FIG U R A
1. Installation: Place your file in the MQL/Indicators folder via "Open Data Folder" and restart your terminal.
2. Loading: Find the indicator in the Navigator, drag it onto your chart, and configure the input parameters in the popup window.
3. Customization: Press Ctrl+I to open the indicator list, select your tool, and click "Properties" to change colors, levels, or visual styles.
4. Updating: Replace the old file in the Indicators folder with the new version and restart the platform to apply changes.
Frequently Asked Questions
Q: Why is my indicator not showing? A: Verify the file is in the MQL/Indicators folder, or try right-clicking the "Indicators" tree in the Navigator and clicking "Refresh."
Q: Do custom indicators slow down the platform? A: Too many complex indicators can impact performance; remove unused ones via the "Indicator List" (Ctrl+I).
Q: Can I use MT4 indicators on MT5? A: No, MQL4 and MQL5 are distinct languages; ensure the indicator is compiled specifically for your platform version.
Description & Settings
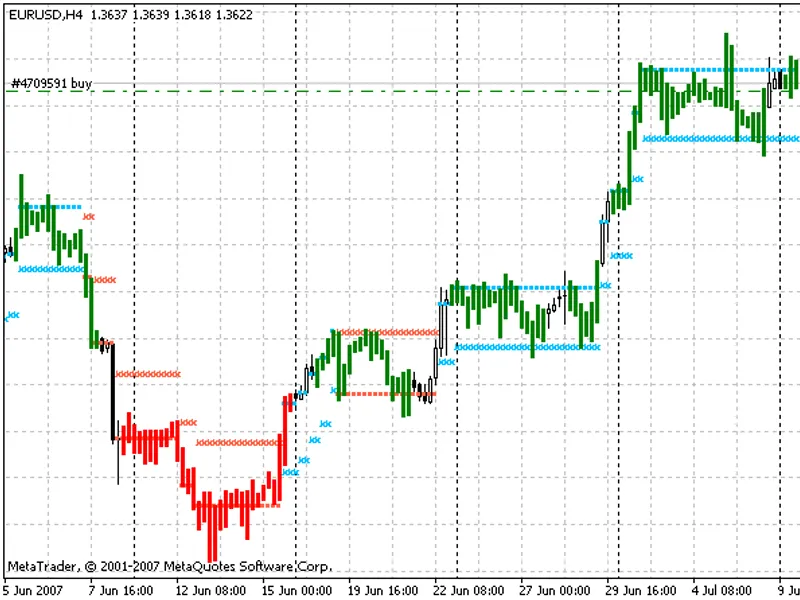
The indicator on the quadrangle patterns, designed to work on hourly timeframes.
Indicator displays quadrangle figure, angles of which are
Daily Open
Daily High
Daily Close
Daily Low
The essence of the system is visual determination of subsequent movement:
If the latter figure has a narrowing and the narrowing is less than the base of the figure, it forecasts continuation of a trend (at least the size of the base)
If the latter figure has an expansion and the expansion is greater than the base of the figure, it predict possible reversal (at least the size of the base)
If the base and the end of the figure are visually equal, a correction is expected
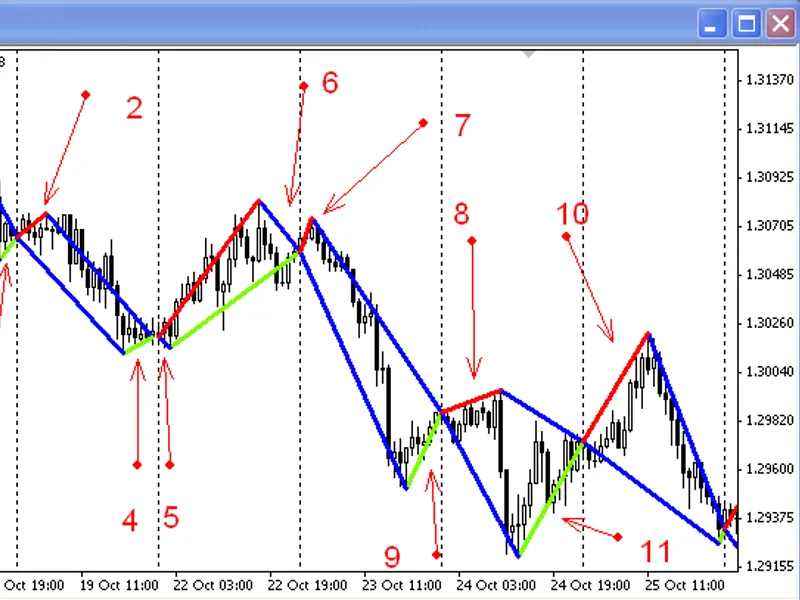
Narrowing 3 is less than base 1 == trend continuation is predicted
Narrowing 4 is approximately equal to the base 2 == flat is predicted
Narrowing 6 is greater than base 5 == change in the trend is predicted
Narrowing 9 is greater than base 7 == change in the trend is predicted
Narrowing 11 is greater than base 8 == change in the trend is predicted