Var Mov Avg 2016 (varmov)
This is a powerful addition to your MetaTrader 4 toolkit designed to optimize market analysis and performance. This technical indicator acts as a specialized analysis tool designed to visualize market data. It helps traders identify emerging trends, momentum shifts, and key support or resistance levels by plotting statistical calculations directly onto price charts.
How to Setup and Use Var Mov Avg 2016 (varmov)
1. Installation: Place your file in the MQL/Indicators folder via "Open Data Folder" and restart your terminal.
2. Loading: Find the indicator in the Navigator, drag it onto your chart, and configure the input parameters in the popup window.
3. Customization: Press Ctrl+I to open the indicator list, select your tool, and click "Properties" to change colors, levels, or visual styles.
4. Updating: Replace the old file in the Indicators folder with the new version and restart the platform to apply changes.
Frequently Asked Questions
Q: Why is my indicator not showing? A: Verify the file is in the MQL/Indicators folder, or try right-clicking the "Indicators" tree in the Navigator and clicking "Refresh."
Q: Do custom indicators slow down the platform? A: Too many complex indicators can impact performance; remove unused ones via the "Indicator List" (Ctrl+I).
Q: Can I use MT4 indicators on MT5? A: No, MQL4 and MQL5 are distinct languages; ensure the indicator is compiled specifically for your platform version.
Description & Settings
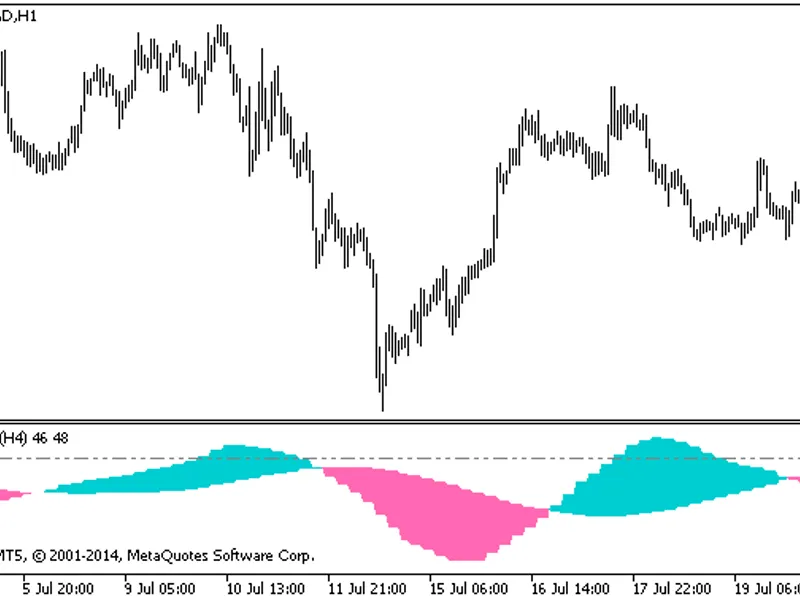
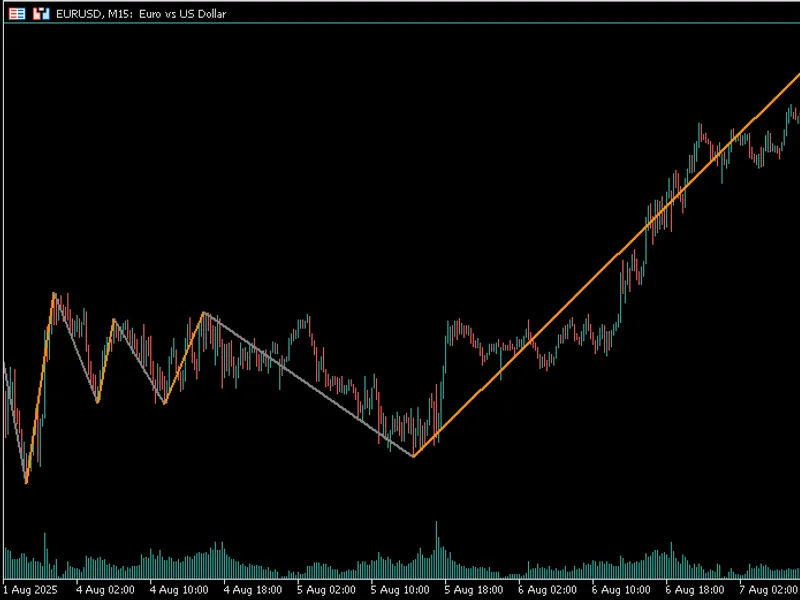
This indicator is based on the moving average, but it doesn't use any standard MT4/MT5 moving average indicators. It uses its own formula to calculate the moving average with a complex noise filter to produce more accurate signals. The indicator displays dotted line in the main chart window exactly over the price curve. The changing colors of the dots signal trend changes. The indicator shows signals on chart (yellow dots by default higher/below price), and also can signal sound alerts on trend changes; you can turn them on and off.
When the dots are pink, the price is in the downtrend. When the dots are blue, the price is in the uptrend. BUY when pink changes to blue and SELL when blue changes to pink. These moments are marked by yellow dots. If the yellow dot is above the price, this is a signal to SELL. If the yellow dot is below the price, this is a signal to BUY. Use moderate Stop Loss to protect yourself from false signals.
Updated in 20 oct, 2016:
now you can change the maximum offset of the signal dots from current price. Change "
offsetInPips
" parameter for it.