spread on chart
This is a powerful addition to your MetaTrader 4 toolkit designed to optimize market analysis and performance. This technical indicator acts as a specialized analysis tool designed to visualize market data. It helps traders identify emerging trends, momentum shifts, and key support or resistance levels by plotting statistical calculations directly onto price charts.
How to Setup and Use spread on chart
1. Installation: Place your file in the MQL/Indicators folder via "Open Data Folder" and restart your terminal.
2. Loading: Find the indicator in the Navigator, drag it onto your chart, and configure the input parameters in the popup window.
3. Customization: Press Ctrl+I to open the indicator list, select your tool, and click "Properties" to change colors, levels, or visual styles.
4. Updating: Replace the old file in the Indicators folder with the new version and restart the platform to apply changes.
Frequently Asked Questions
Q: Why is my indicator not showing? A: Verify the file is in the MQL/Indicators folder, or try right-clicking the "Indicators" tree in the Navigator and clicking "Refresh."
Q: Do custom indicators slow down the platform? A: Too many complex indicators can impact performance; remove unused ones via the "Indicator List" (Ctrl+I).
Q: Can I use MT4 indicators on MT5? A: No, MQL4 and MQL5 are distinct languages; ensure the indicator is compiled specifically for your platform version.
Description & Settings
Introduction
Since 2008 the most of the dealing centers began to work with the "floating" spreads. During the night the spreads are often wider. The wide spreads are appear during the news.
The spread increasing can be sufficient, so in such cases some trading systems cannot be profitable. The stop level can be increased several times, it may cause the incorrect work of the Expert Advisors with fixed Stop Loss and Take Profit values.
The Strategy Tester of MetaTrader 4 client terminal uses the last known values of spread, stop level and freeze level, the result is dependent on these values. The client terminal uses the historical spread values, the structure of historical data prices has the corresponding field.
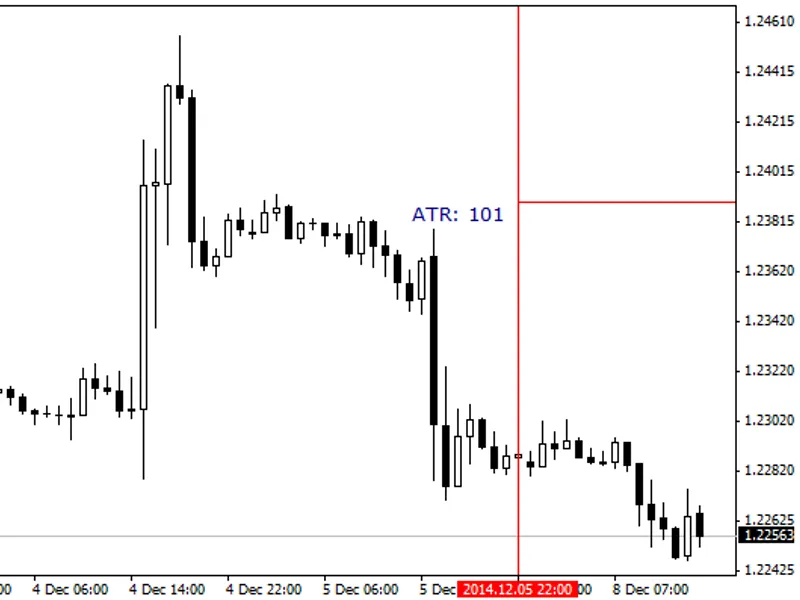
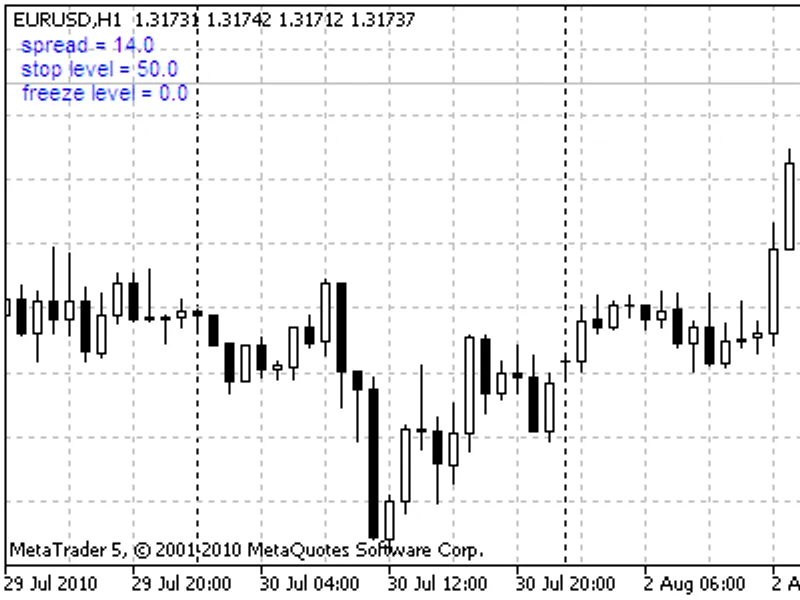
The spread_on_chart indicator shows the following values on the chart:
spread (the difference between current Ask and Bid);
stop level (the minimal distance from the current price to Stop Loss and Take Profit);
freeze level (the minimal distance for orders modifying).
It updates every tick.
Input parameters:
Corner - chart corner for output. By default - upper left corner is used;
XMargin, YMargin - horizontal and vertical margins;
Font, Color, Size - font name, font color and font size.
File list:
spread_on_chart.mq4 - (MetaTrader 4).