Sliders
This software component for MetaTrader 4 is built to enhance the capabilities of your trading environment. This technical indicator acts as a specialized analysis tool designed to visualize market data. It helps traders identify emerging trends, momentum shifts, and key support or resistance levels by plotting statistical calculations directly onto price charts.
How to Setup and Use Sliders
1. Installation: Place your file in the MQL/Indicators folder via "Open Data Folder" and restart your terminal.
2. Loading: Find the indicator in the Navigator, drag it onto your chart, and configure the input parameters in the popup window.
3. Customization: Press Ctrl+I to open the indicator list, select your tool, and click "Properties" to change colors, levels, or visual styles.
4. Updating: Replace the old file in the Indicators folder with the new version and restart the platform to apply changes.
Frequently Asked Questions
Q: Why is my indicator not showing? A: Verify the file is in the MQL/Indicators folder, or try right-clicking the "Indicators" tree in the Navigator and clicking "Refresh."
Q: Do custom indicators slow down the platform? A: Too many complex indicators can impact performance; remove unused ones via the "Indicator List" (Ctrl+I).
Q: Can I use MT4 indicators on MT5? A: No, MQL4 and MQL5 are distinct languages; ensure the indicator is compiled specifically for your platform version.
Description & Settings
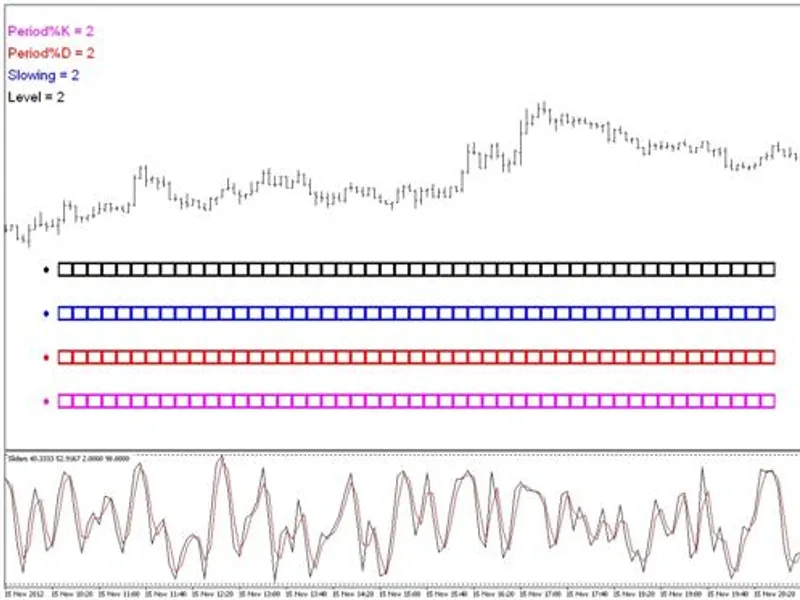
Adjust the period (and other values) of a technical indicator quickly and easily, by using up to 4 visual "sliders" in the chart window - without having to manually change the values in the input window or even having to take your eyes off the indicator.
Each slider consists of up to 50 separate boxes in a horizontal line across the chart window. Each box has an associated value. There is a circular "marker" or "token" which can be placed in any box to select that value. The selected value is then applied to the chosen parameter of the indicator in the separate window, and the indicator is automatically updated. This indicator uses MT4 chart objects, and makes no use of DLLs.
The external variables allow you to choose how many sliders to display (up to 4), what values to start and end each slider with, the increment of value increase between each subsequent box (up to a maximum of 50 boxes per slider), the description and colour associated with each slider, the number of bars to be counted in the indicator and whether or not to display the X and Y coordinates of the first marker. The slider values may include decimals and/or minus numbers.
The chart objects are displayed as labels, and therefore will stick to the window. The object positions are set by X and Y coordinates. The default settings for these coordinates are described within the code and can be easily adjusted (requiring a re-compilation).
The default indicator is Stochastic. If you would like to use a different indicator then enter the relevant code in lines 448-451, and simply replace one of the parameters with the relevant slider array.
If you would like to use an indicator which is displayed in the chart window then change line 34 to "#property indicator_chart_window".
The slider values will only update once per tick. If you wish to use this when there are no ticks coming in (eg. at the weekend) then you will need to update the chart in another way. One method is simply to press Alt+C+R. Another method is to use a separate script which will automatically post a "fake tick", such as the one described here: .