Average Directional Movement Index (AD X)
This tool for MetaTrader 5 is specifically engineered to streamline your trading operations. This technical indicator acts as a specialized analysis tool designed to visualize market data. It helps traders identify emerging trends, momentum shifts, and key support or resistance levels by plotting statistical calculations directly onto price charts.
How to Setup and Use Average Directional Movement Index (AD X)
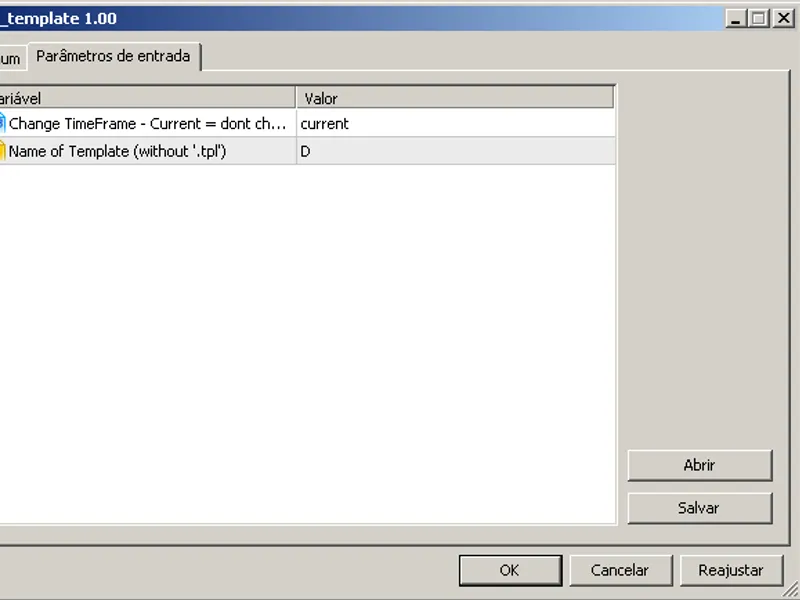
1. Installation: Place your file in the MQL/Indicators folder via "Open Data Folder" and restart your terminal.
2. Loading: Find the indicator in the Navigator, drag it onto your chart, and configure the input parameters in the popup window.
3. Customization: Press Ctrl+I to open the indicator list, select your tool, and click "Properties" to change colors, levels, or visual styles.
4. Updating: Replace the old file in the Indicators folder with the new version and restart the platform to apply changes.
Frequently Asked Questions
Q: Why is my indicator not showing? A: Verify the file is in the MQL/Indicators folder, or try right-clicking the "Indicators" tree in the Navigator and clicking "Refresh."
Q: Do custom indicators slow down the platform? A: Too many complex indicators can impact performance; remove unused ones via the "Indicator List" (Ctrl+I).
Q: Can I use MT4 indicators on MT5? A: No, MQL4 and MQL5 are distinct languages; ensure the indicator is compiled specifically for your platform version.
Description & Settings
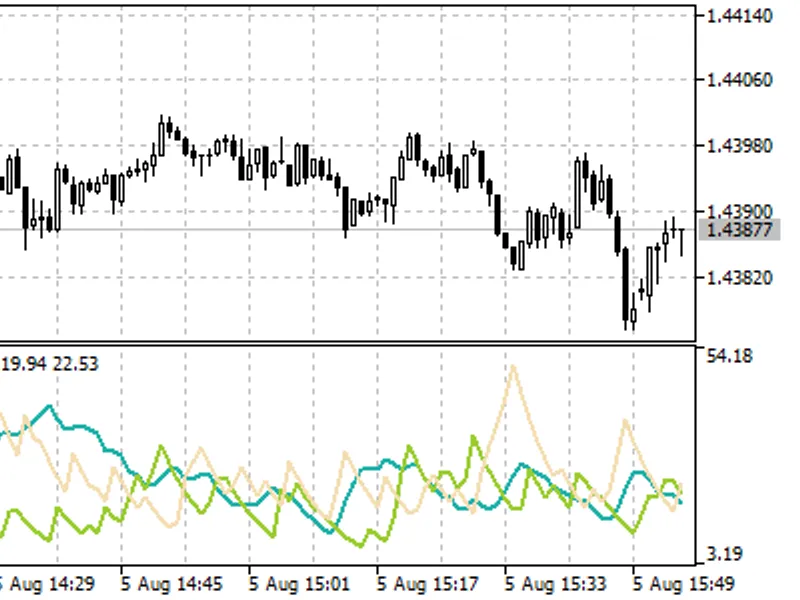
Average Directional Movement Index technical indicator (ADX) helps to determine the market trend. It was developed and described in detail by Welles Wilder in his book "New concepts in technical trading systems".
The simplest trading method based on the system of directional movement implies comparison of two direction indicators: the 14-period +DI one and the 14-period -DI. To do this, one either puts the charts of indicators one on top of the other, or +DI is subtracted from -DI. W. Wilder recommends buying whenever the +DI crosses above the -DI, and selling when -DI crosses above the +DI.In addition to these simple commercial rules, Wells Wilder offered the extreme point rule. It is used to eliminate false signals and decrease the number of deals. According to the principle of extreme points, the "extreme point" occurs when +DI and -DI cross each other. If +DI raises higher than -DI, this point will be the maximum price of the day when they cross. If +DI is lower than -DI, this point will be the minimum price of the day they cross.
The extreme point is used then as the market entry level. Thus, after the signal to buy (+DI is above -DI) one must wait till the price exceeds the extreme point, and only then buy. However, if the price fails to exceed the level of the extreme point, one should retain the short position.
ADX Indicator
Calculation:
ADX = SUM ((+DI - (-DI)) / (+DI + (-DI)), N) / N
where:
N - the number of periods used in the calculation;
SUM (..., N) - sum for N periods;
+DI - value of the indicator of the positive price movement (positive directional index);
-DI - value of the indicator of the negative price movement (negative directional index).