Simple Horizontal Grid
This tool for MetaTrader 4 is specifically engineered to streamline your trading operations. This technical indicator acts as a specialized analysis tool designed to visualize market data. It helps traders identify emerging trends, momentum shifts, and key support or resistance levels by plotting statistical calculations directly onto price charts.
How to Setup and Use Simple Horizontal Grid
1. Installation: Place your file in the MQL/Indicators folder via "Open Data Folder" and restart your terminal.
2. Loading: Find the indicator in the Navigator, drag it onto your chart, and configure the input parameters in the popup window.
3. Customization: Press Ctrl+I to open the indicator list, select your tool, and click "Properties" to change colors, levels, or visual styles.
4. Updating: Replace the old file in the Indicators folder with the new version and restart the platform to apply changes.
Frequently Asked Questions
Q: Why is my indicator not showing? A: Verify the file is in the MQL/Indicators folder, or try right-clicking the "Indicators" tree in the Navigator and clicking "Refresh."
Q: Do custom indicators slow down the platform? A: Too many complex indicators can impact performance; remove unused ones via the "Indicator List" (Ctrl+I).
Q: Can I use MT4 indicators on MT5? A: No, MQL4 and MQL5 are distinct languages; ensure the indicator is compiled specifically for your platform version.
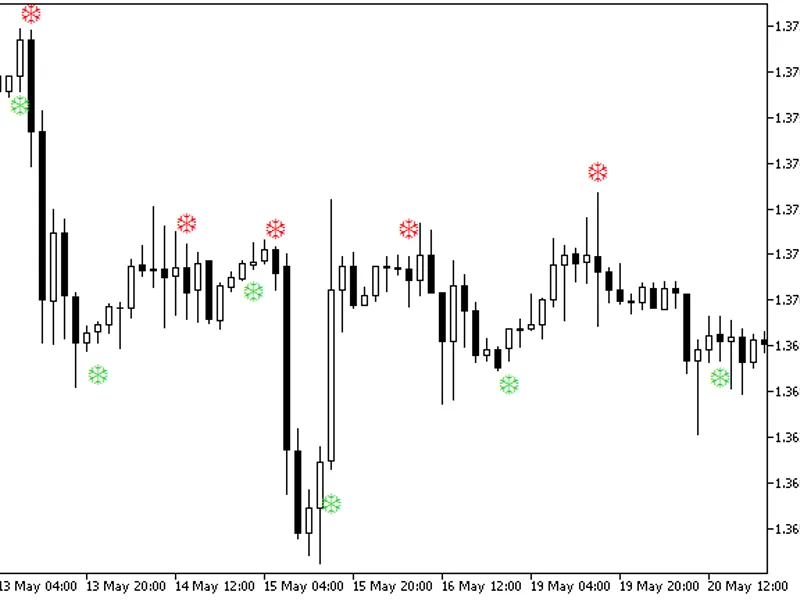
Description & Settings
The indicator places a series of equidistant adaptive horizontal lines to a chart. The lines are updated with every chart change and are independent on symbol or scale. If the user changes the vertical scale, the indicator adds or removes lines accordingly.
The lines have two colours, the primary colour is dedicated to lines glued to round numbers, the weak colour is for secondary lines equidistantly placed between the round-number lines.
The user may swap their colours.
The indicator works out of box, but user may adjust a few parameters.
Additional input settings:
density of lines (distance between lines)
number of secondary lines between two primary lines
switch off displaying the primary line labels on the scale
Recommendations:
The standard grid should be switched off (ctrl+G) when using this indicator
Switching the object descriptions on (F8 - Show Objects Description) makes visible line labels on left. They may be used as a substitute for the hidden scale labels.