Linear Regression Channel
This professional-grade solution for MetaTrader 5 helps traders achieve greater efficiency in their daily workflow. This technical indicator acts as a specialized analysis tool designed to visualize market data. It helps traders identify emerging trends, momentum shifts, and key support or resistance levels by plotting statistical calculations directly onto price charts.
How to Setup and Use Linear Regression Channel
1. Installation: Place your file in the MQL/Indicators folder via "Open Data Folder" and restart your terminal.
2. Loading: Find the indicator in the Navigator, drag it onto your chart, and configure the input parameters in the popup window.
3. Customization: Press Ctrl+I to open the indicator list, select your tool, and click "Properties" to change colors, levels, or visual styles.
4. Updating: Replace the old file in the Indicators folder with the new version and restart the platform to apply changes.
Frequently Asked Questions
Q: Why is my indicator not showing? A: Verify the file is in the MQL/Indicators folder, or try right-clicking the "Indicators" tree in the Navigator and clicking "Refresh."
Q: Do custom indicators slow down the platform? A: Too many complex indicators can impact performance; remove unused ones via the "Indicator List" (Ctrl+I).
Q: Can I use MT4 indicators on MT5? A: No, MQL4 and MQL5 are distinct languages; ensure the indicator is compiled specifically for your platform version.
Description & Settings
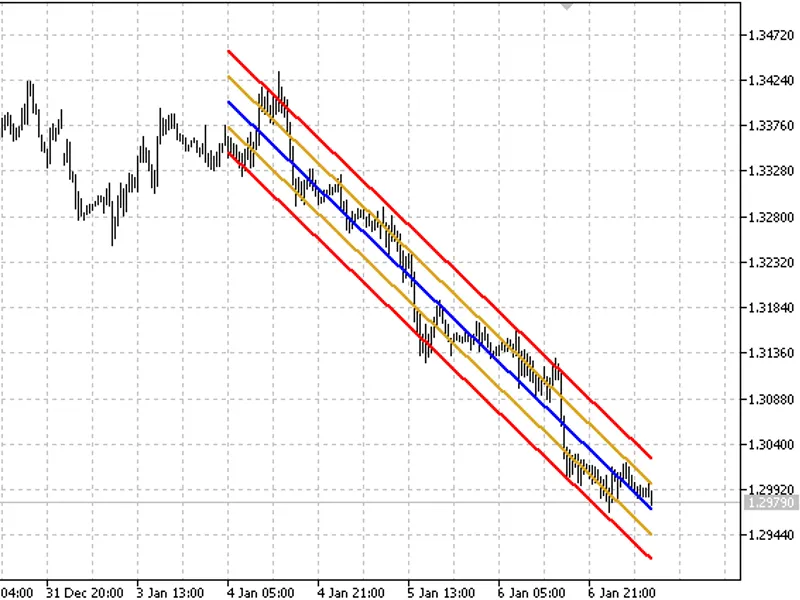
The indicator plots a channel using the linear regression model: y=b+a*x.
When calculation of regression coefficients (a and b) it uses only completed bars. The number of bars should be greater than 2 (and less than total bars in history-1), it is specified in InChPeriod input parameter. The indicator values for the last (uncompleted) bar is calculated using the values of calculated regression coefficients.
It's assumed, that:
not less than 68.26% of price values are located between the "Up" and "Down" lines.
not less than 95.44% of price values are located between the "High" and "Low" lines.
The recalculation of the regression coefficient is performed when total bars in the history has changed, for example, for the case of a new bar.