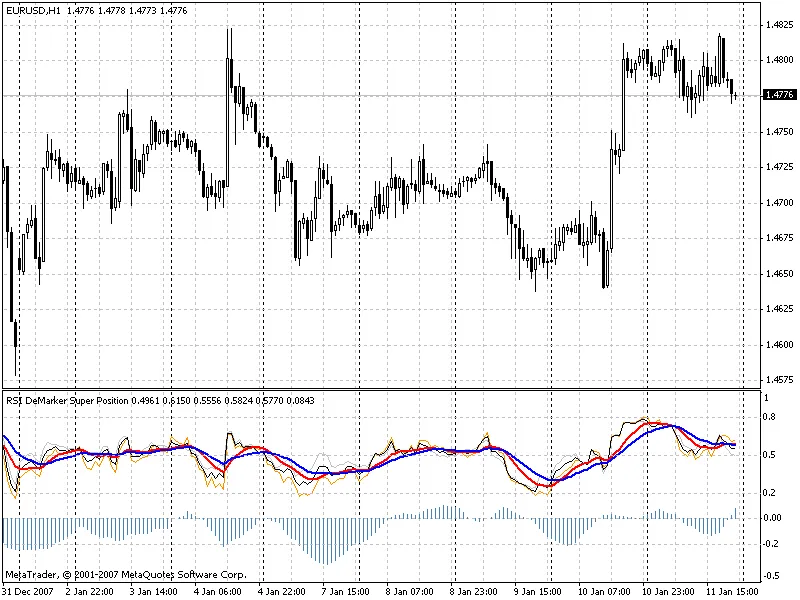
RS I De Marker Super Position
This software component for MetaTrader 4 is built to enhance the capabilities of your trading environment. This technical indicator acts as a specialized analysis tool designed to visualize market data. It helps traders identify emerging trends, momentum shifts, and key support or resistance levels by plotting statistical calculations directly onto price charts.
How to Setup and Use RS I De Marker Super Position
1. Installation: Place your file in the MQL/Indicators folder via "Open Data Folder" and restart your terminal.
2. Loading: Find the indicator in the Navigator, drag it onto your chart, and configure the input parameters in the popup window.
3. Customization: Press Ctrl+I to open the indicator list, select your tool, and click "Properties" to change colors, levels, or visual styles.
4. Updating: Replace the old file in the Indicators folder with the new version and restart the platform to apply changes.
Frequently Asked Questions
Q: Why is my indicator not showing? A: Verify the file is in the MQL/Indicators folder, or try right-clicking the "Indicators" tree in the Navigator and clicking "Refresh."
Q: Do custom indicators slow down the platform? A: Too many complex indicators can impact performance; remove unused ones via the "Indicator List" (Ctrl+I).
Q: Can I use MT4 indicators on MT5? A: No, MQL4 and MQL5 are distinct languages; ensure the indicator is compiled specifically for your platform version.
Description & Settings
As a rule it takes a lot of time to switch between periods and indicator parameters for comparing their behavior and detecting a true indicator development dynamics.
The indicator was developed after the working area was filled by a set of standard indicators with different parameters.
What is calculated:
four RSI lines with different periods (the period change step is specified in the indicator parameters) constitute a weighted average of the indicator upon RSI;
four DeMarker lines with different periods (the period change step is specified in the indicator parameters) constitute a weighted average of the indicator upon DeMarker;
because of the difference of RSI and DeMarker dimensions, the values of averages are reduced to a common way of displaying;
the moving average upon RSI and DeMarker constitute a super position upon two indicators;
two MA lines are attached to the super position line for an easier interpretation of values;
for a better visualization, a histogram of difference between RSI and DeMarker weighted averages is shown.
The result is: one indicator contains two values of different periods and different dynamics.
RSI and DeMarker behave differently not only in different situations on a chart, abut also towards themselves with different indicator periods. I think, it is useful to see this difference.
In addition to this, a smoothing of the superposition line can be introduced.