Rj HSlice 1. 1
This software component for MetaTrader 4 is built to enhance the capabilities of your trading environment. This technical indicator acts as a specialized analysis tool designed to visualize market data. It helps traders identify emerging trends, momentum shifts, and key support or resistance levels by plotting statistical calculations directly onto price charts.
How to Setup and Use Rj HSlice 1. 1
1. Installation: Place your file in the MQL/Indicators folder via "Open Data Folder" and restart your terminal.
2. Loading: Find the indicator in the Navigator, drag it onto your chart, and configure the input parameters in the popup window.
3. Customization: Press Ctrl+I to open the indicator list, select your tool, and click "Properties" to change colors, levels, or visual styles.
4. Updating: Replace the old file in the Indicators folder with the new version and restart the platform to apply changes.
Frequently Asked Questions
Q: Why is my indicator not showing? A: Verify the file is in the MQL/Indicators folder, or try right-clicking the "Indicators" tree in the Navigator and clicking "Refresh."
Q: Do custom indicators slow down the platform? A: Too many complex indicators can impact performance; remove unused ones via the "Indicator List" (Ctrl+I).
Q: Can I use MT4 indicators on MT5? A: No, MQL4 and MQL5 are distinct languages; ensure the indicator is compiled specifically for your platform version.
Description & Settings
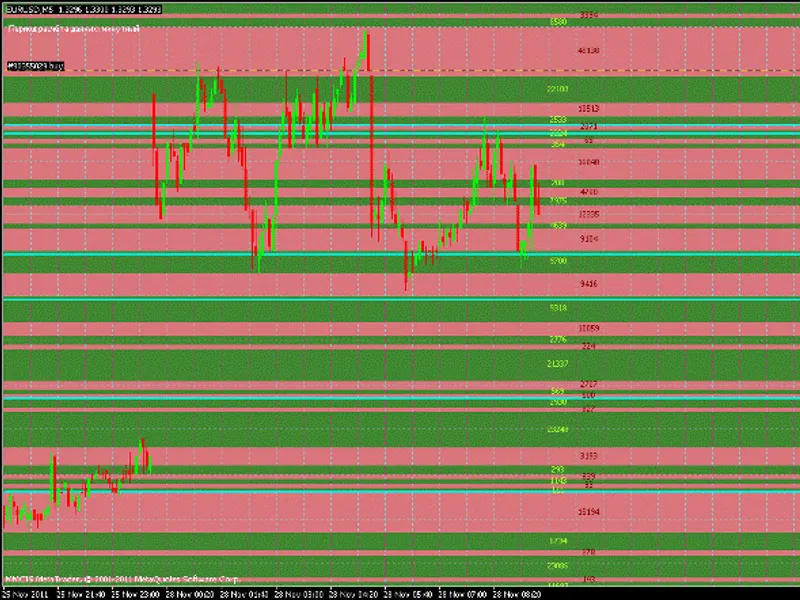
The indicator shows the buy/sell ranges.
The green zone means that at these price levels, more buys in a certain period of time, represents a numerical value on how many contracts the difference. The red zone represents the sells. So somewhere between Call/Put and Support/Resistance.
The indicator calculates Rj_Volume minute period and transmits the data to Rj_HSlice 1.1. This indicator should be used in conjunction with other indicators. Installation: Throws two files in Terminal \ experts \ indicators, compiling editor and Rj_HSlice attach to the chart. Rj_Volume do not attach to the chart. Lack of him that on the 5-digit terminal value bump against each other. In Rj_HSlice 1.1 added modified HF calculation data, ie not only minute blunder, but the other FFs. CalcPeriod = 1, all in minutes. If the rendering must be done in the time say FF, then the place must 60. Protection against configuration errors, even if it put 50, it will still look for the closest senior timeframe. In a commentary in the upper left corner indicates which TF is calculated. ShowLevelsOn = true; by default shows all price levels. false removes all levels. ShowContractOn = true; same thing, only with the values of the contracts. removes all false values. BackgroundLevelOn = true; When the ShowLevelsOn background rendering. ShowTurningOn = true; Sets the support line of resistance. At certain levels, values of contracts are similar. To do this, there is an option PercentDiscrep = 0.2; rate differences, by default, 20%, ie difference between the levels of no more than 20%. 0.1 is 10%, etc etc. The lines are changed dynamically, but you can still keep track of where and how the price behaves, respectively, from this you can draw any conclusions. ColorLine = Aqua; color lines.
ShowLevelsOn = false.
If you are interested, the essence of the idea is as follows: If the candle Open [] <Close [], then buy = (High []-Low [])+( Close []-Open []) sell = High []-Low [] then dist = Volume [] / (buy + sell) = volume of distribution / point, and then the arrays are going to Call = dist * buy / sell Put = dist Same with the bearish candle, just mirrored. Who to test a blue screen or it shows nothing or history must upload or save it as a template. So watch the Experiment, ask questions, answer all the possible profit to the connection.