Optimize single Moving average trading
This professional-grade solution for MetaTrader 4 helps traders achieve greater efficiency in their daily workflow. This technical indicator acts as a specialized analysis tool designed to visualize market data. It helps traders identify emerging trends, momentum shifts, and key support or resistance levels by plotting statistical calculations directly onto price charts.
How to Setup and Use Optimize single Moving average trading
1. Installation: Place your file in the MQL/Indicators folder via "Open Data Folder" and restart your terminal.
2. Loading: Find the indicator in the Navigator, drag it onto your chart, and configure the input parameters in the popup window.
3. Customization: Press Ctrl+I to open the indicator list, select your tool, and click "Properties" to change colors, levels, or visual styles.
4. Updating: Replace the old file in the Indicators folder with the new version and restart the platform to apply changes.
Frequently Asked Questions
Q: Why is my indicator not showing? A: Verify the file is in the MQL/Indicators folder, or try right-clicking the "Indicators" tree in the Navigator and clicking "Refresh."
Q: Do custom indicators slow down the platform? A: Too many complex indicators can impact performance; remove unused ones via the "Indicator List" (Ctrl+I).
Q: Can I use MT4 indicators on MT5? A: No, MQL4 and MQL5 are distinct languages; ensure the indicator is compiled specifically for your platform version.
Description & Settings
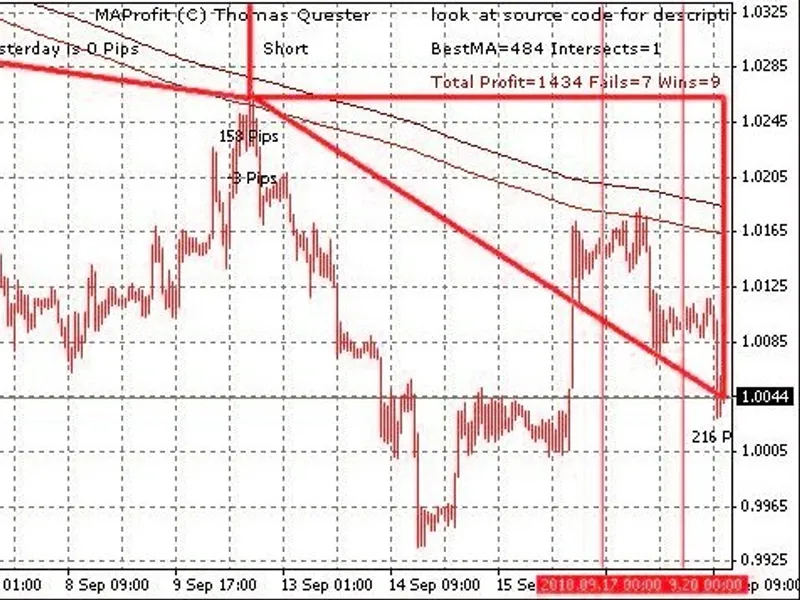
This code is following the idea of MA Profit, except that it is using a single Moving Average instead of the cross moving average system.
Using only a single moving average speeds up optimization, it can check all moving averages between 10 and 1000 in nearly no time.
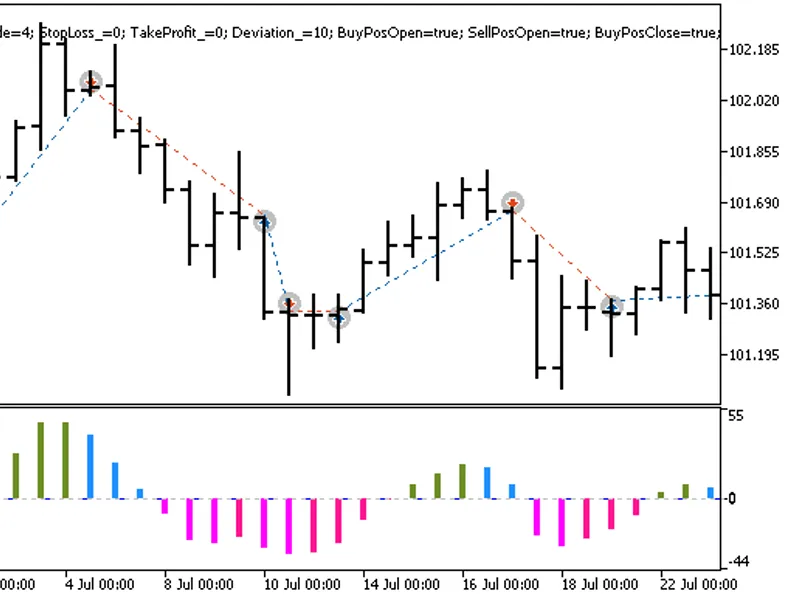
Trading with single moving average gives three signals. Usually it works with large moving averages like 150 or even 500 or more.
The curve is below the candles - buy
The curve is above the candles - sell
the curve is horizontal and many times crossing the candles - close positions and wait
By switching the period everything is re-calculated, you can check if different time frames (minute, hour, day and so on) show the same signal. Usually a signal is stronger if displayed by by multiple time frames. Also you can switch to lower time frame in order to find an entry point into a long or short trade.
The indicator draws 4 kinds of triangles
The indicator dispays the status and the number for good and wrong signals in its status line.
The optimization can be in two modes:
Simulated trading. The best moving average is the one which gave the best profit
Counting intersections between candles. The less time the curve and the candles hit each other the better the moving average is.
Parameters: (look source code also)
extern bool bOptimize=true; // True: Find the best single MA by optimizing (switch time frame to re-optimize) extern bool bOptimizeIntersect=true; // True: optimize for minimum intersections, otherwise optimize for max profit extern int PeriodMA=400; // If you do not want to optimize, you can define a period extern int Method=0; // Method for MA 0 = Simple, 1 = Expotential, 2 = Smoothed, 3 = Linear weighted extern bool DrawTringles=true; // Draws triangles for the simulated trading extern int MinMA=5; // Minimum test for optimizing extern int MaxMA=500; // Maximum test for optimizing extern int StepMA=1; // Step during optimizion, 1 tests every MA, 10 tests every 10th etc. extern int CountOptimize=300; // Number of candles for optimizing extern int RepaintBars=3000; // Number of candles on which we draw triangles and calculate the win/loss extern bool Alarm=true; // Make a visible alert on new signal extern bool bSpeak=true; // Speak the alert with gspeak
Moving average trading gives some very good signal but also a lot of false signals. I am currently seeking more ideas of filtering the false signal in order to publish my moving average expert advisor.
Plese use at your own risk!