XAN D E R Adaptive Cross
This is a powerful addition to your MetaTrader 5 toolkit designed to optimize market analysis and performance. This technical indicator acts as a specialized analysis tool designed to visualize market data. It helps traders identify emerging trends, momentum shifts, and key support or resistance levels by plotting statistical calculations directly onto price charts.
How to Setup and Use XAN D E R Adaptive Cross
1. Installation: Place your file in the MQL/Indicators folder via "Open Data Folder" and restart your terminal.
2. Loading: Find the indicator in the Navigator, drag it onto your chart, and configure the input parameters in the popup window.
3. Customization: Press Ctrl+I to open the indicator list, select your tool, and click "Properties" to change colors, levels, or visual styles.
4. Updating: Replace the old file in the Indicators folder with the new version and restart the platform to apply changes.
Frequently Asked Questions
Q: Why is my indicator not showing? A: Verify the file is in the MQL/Indicators folder, or try right-clicking the "Indicators" tree in the Navigator and clicking "Refresh."
Q: Do custom indicators slow down the platform? A: Too many complex indicators can impact performance; remove unused ones via the "Indicator List" (Ctrl+I).
Q: Can I use MT4 indicators on MT5? A: No, MQL4 and MQL5 are distinct languages; ensure the indicator is compiled specifically for your platform version.
Description & Settings
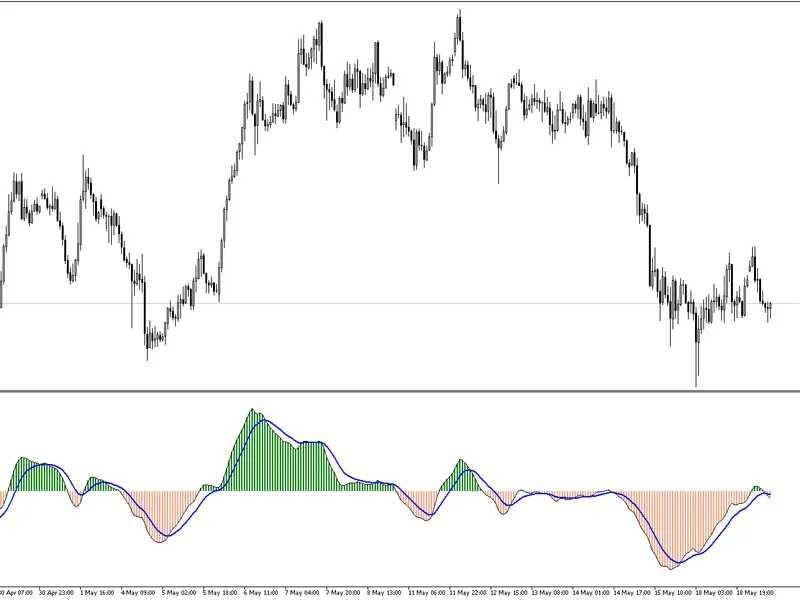
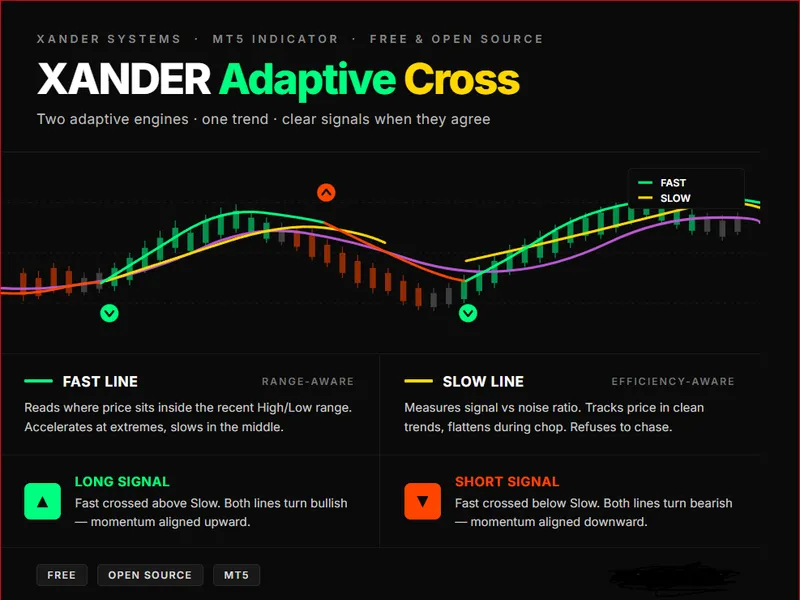
XANDER Adaptive Cross
plots two adaptive moving averages on your chart, each one
reading the market through a different lens. When they cross, the system flags a trend shift with a color-coded arrow. When they align, you ride the trend with visual confirmation from both lines. ━━━━━━━━━━━━━━━━━━━━━━━━━━━━━━ 🔍 HOW THE TWO LINES THINK ━━━━━━━━━━━━━━━━━━━━━━━━━━━━━━ ▸ FAST LINE — Range-aware adaptive Reads where the current price sits inside the recent High/Low range. When price hugs the extremes, the line accelerates — capturing breakouts fast. When price drifts in the middle of the range, it slows down — filtering noise. ▸ SLOW LINE — Efficiency-aware adaptive Measures the ratio between net price movement and total path traveled. When the market is trending cleanly, the line tracks price closely. When the market is choppy or noisy, the line flattens — refusing to chase. The two lines don't see the same thing. That's the point. When they agree, you have conviction. When they disagree, you have warning. ━━━━━━━━━━━━━━━━━━━━━━━━━━━━━━ 🎨 COLOR LANGUAGE ━━━━━━━━━━━━━━━━━━━━━━━━━━━━━━ FAST LINE 🟢 Spring Green — Fast line above Slow (bullish bias) 🔴 Orange Red — Fast line below Slow (bearish bias) SLOW LINE 🟡 Gold — Fast line above Slow (bullish bias) 🟣 Orchid — Fast line below Slow (bearish bias) ⚪ Dim Gray on either line — undefined or transitioning state ARROWS 🟢 Green arrow below candle — Fast just crossed above Slow (long signal) 🔴 Red arrow above candle — Fast just crossed below Slow (short signal) ━━━━━━━━━━━━━━━━━━━━━━━━━━━━━━ 📌 HOW TO USE ━━━━━━━━━━━━━━━━━━━━━━━━━━━━━━ - Wait for an arrow — that's your potential entry trigger. - Confirm both lines have switched to their bullish or bearish color. - Use the Slow line as a dynamic trailing reference. - Avoid trading when both lines are flat and gray — the market is undecided. - Higher timeframe = stronger signal. Test on M15 and above for cleaner results. ━━━━━━━━━━━━━━━━━━━━━━━━━━━━━━ ⚙️ KEY PARAMETERS ━━━━━━━━━━━━━━━━━━━━━━━━━━━━━━ - Adaptive Period — Lookback window for both adaptive calculations (default 14). - Fast Smoothing Period — Maximum responsiveness of the adaptive engines (2). - Slow Smoothing Period — Maximum smoothing in flat markets (30). - Efficiency Curve Power — Curvature of the adaptation (default 2.0). - Applied Price — Close, Open, High, Low, Median, Typical, or Weighted. ━━━━━━━━━━━━━━━━━━━━━━━━━━━━━━ ✨ ABOUT XANDER SYSTEMS ━━━━━━━━━━━━━━━━━━━━━━━━━━━━━━ Free open-source tools for serious traders. Built for dark charts, designed for clarity. 💼 Freelance & custom development :