Normalized Volume Oscillator
This software component for MetaTrader 5 is built to enhance the capabilities of your trading environment. This technical indicator acts as a specialized analysis tool designed to visualize market data. It helps traders identify emerging trends, momentum shifts, and key support or resistance levels by plotting statistical calculations directly onto price charts.
How to Setup and Use Normalized Volume Oscillator
1. Installation: Place your file in the MQL/Indicators folder via "Open Data Folder" and restart your terminal.
2. Loading: Find the indicator in the Navigator, drag it onto your chart, and configure the input parameters in the popup window.
3. Customization: Press Ctrl+I to open the indicator list, select your tool, and click "Properties" to change colors, levels, or visual styles.
4. Updating: Replace the old file in the Indicators folder with the new version and restart the platform to apply changes.
Frequently Asked Questions
Q: Why is my indicator not showing? A: Verify the file is in the MQL/Indicators folder, or try right-clicking the "Indicators" tree in the Navigator and clicking "Refresh."
Q: Do custom indicators slow down the platform? A: Too many complex indicators can impact performance; remove unused ones via the "Indicator List" (Ctrl+I).
Q: Can I use MT4 indicators on MT5? A: No, MQL4 and MQL5 are distinct languages; ensure the indicator is compiled specifically for your platform version.
Description & Settings
Vadim Shumiloff
The indicator is the development of the idea of the normalized volumes ().
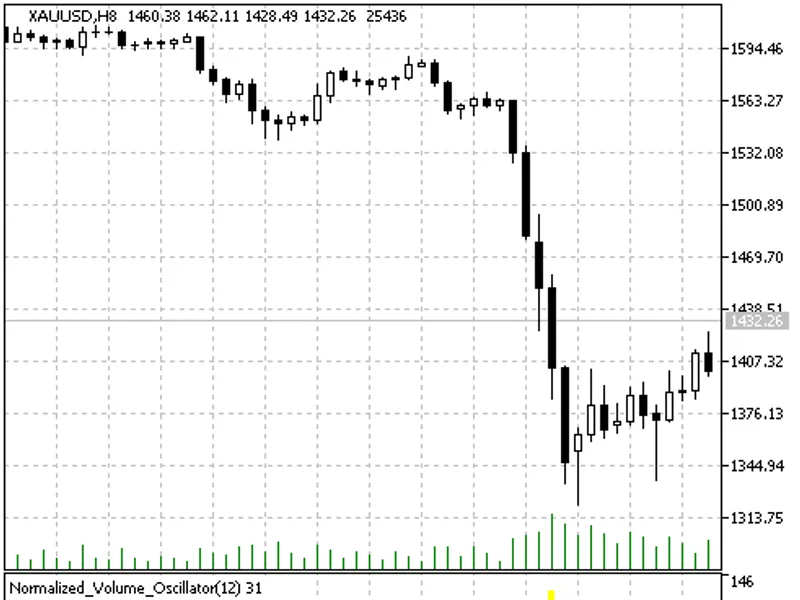
At first, volume normalized values are expressed now as a percentage of the average value for the period. Accordingly, the data in the chart can now take negative values which indicates of the silence in the market.
Another useful innovation is the histogram bar coloring depending on the normalized volume value.
The blue color indicates that the current volume is less than the average one for the period;
The dark green color indicates a little increase of volume compared to the average one for the period;
The light green color indicates that increase of volume overcame Fibo level of 38.2% compared to the average one for the period;
The orange color indicates that increase of volume overcame Fibo level of 61,8% compared to the average one for the period;
The yellow color indicates that increase of volume overcame Fibo level of 100% compared to the average one for the period;
This indicator was first implemented in MQL4 and published in on 19.06.2008.
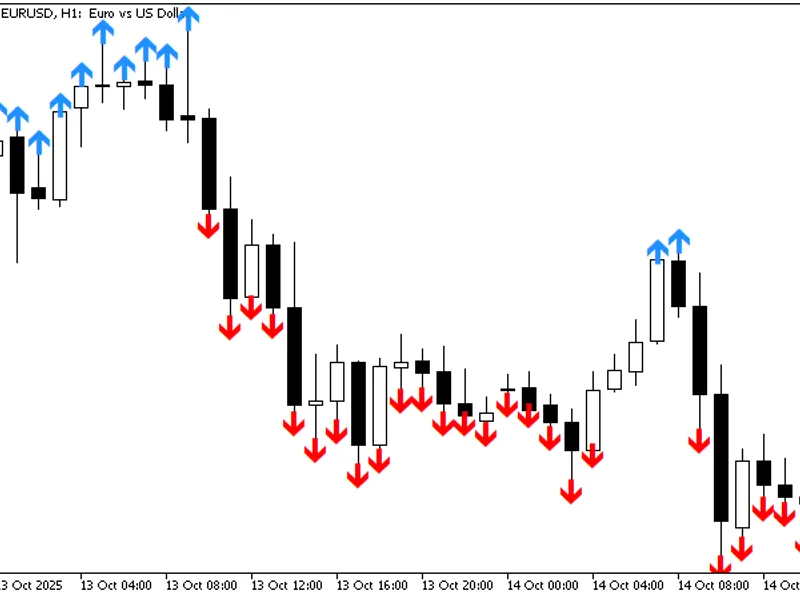
Fig.1 The Normalized_Volume_Oscillator indicator