Money Flow Index (MF I)
This professional-grade solution for MetaTrader 5 helps traders achieve greater efficiency in their daily workflow. This technical indicator acts as a specialized analysis tool designed to visualize market data. It helps traders identify emerging trends, momentum shifts, and key support or resistance levels by plotting statistical calculations directly onto price charts.
How to Setup and Use Money Flow Index (MF I)
1. Installation: Place your file in the MQL/Indicators folder via "Open Data Folder" and restart your terminal.
2. Loading: Find the indicator in the Navigator, drag it onto your chart, and configure the input parameters in the popup window.
3. Customization: Press Ctrl+I to open the indicator list, select your tool, and click "Properties" to change colors, levels, or visual styles.
4. Updating: Replace the old file in the Indicators folder with the new version and restart the platform to apply changes.
Frequently Asked Questions
Q: Why is my indicator not showing? A: Verify the file is in the MQL/Indicators folder, or try right-clicking the "Indicators" tree in the Navigator and clicking "Refresh."
Q: Do custom indicators slow down the platform? A: Too many complex indicators can impact performance; remove unused ones via the "Indicator List" (Ctrl+I).
Q: Can I use MT4 indicators on MT5? A: No, MQL4 and MQL5 are distinct languages; ensure the indicator is compiled specifically for your platform version.
Description & Settings
Money Flow Index (MFI) is the technical indicator, which indicates the rate at which money is invested into a security and then withdrawn from it.
Construction and interpretation of the indicator is similar to Relative Strength Index with the only difference that volume is important to MFI.
When analyzing the money flow index one needs to take into consideration the following points:
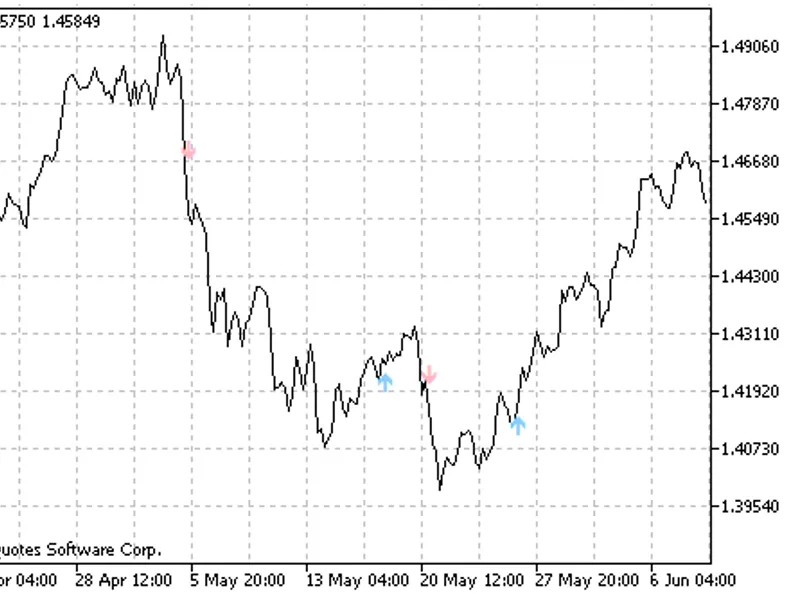
Divergences between the indicator and price movement. If prices grow while MFI falls (or vice versa), there is a great probability of a price reversal;
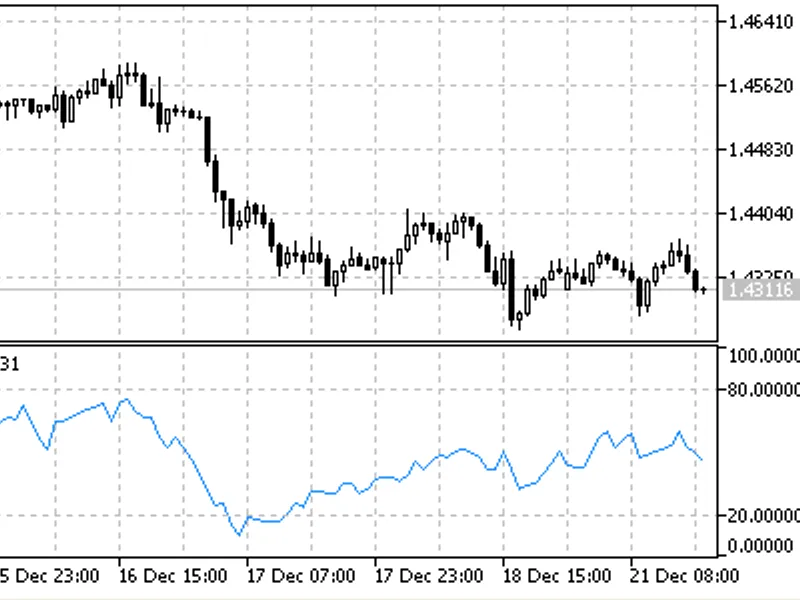
Money Flow Index value, which is over 80 or under 20, signals correspondingly of a potential peak or bottom of the market. Image:
Money Flow Index indicator
Calculation:
The calculation of Money Flow Index includes several stages. At first one defines the typical price (TP) of the period in question:
TP = (HIGH + LOW + CLOSE) / 3
Then one calculates the amount of the Money Flow (MF):
MF = TP * VOLUME
If today’s typical price is larger than yesterday’s TP, then the money flow is considered positive. If today’s typical price is lower than that of yesterday, the money flow is considered negative.
POSITIVE MONEY FLOW is a sum of positive money flows for a selected period of time. NEGATIVE MONEY FLOW is the sum of negative money flows for a selected period of time.
Then one calculates the money ratio (MR) by dividing the positive money flow by the negative money flow:
MR = POSITIVE MONEY FLOW / NEGATIVE MONEY FLOW
And finally, one calculates the money flow index using the money ratio:
MFI = 100 - (100 / (1 + MR))
where:
HIGH - the highest price of the current bar;
LOW - the lowest price of the current bar;
CLOSE - close price of the current bar;
VOLUME - volume of the current bar.