Average Sentiment Oscillator
This software component for MetaTrader 4 is built to enhance the capabilities of your trading environment. This technical indicator acts as a specialized analysis tool designed to visualize market data. It helps traders identify emerging trends, momentum shifts, and key support or resistance levels by plotting statistical calculations directly onto price charts.
How to Setup and Use Average Sentiment Oscillator
1. Installation: Place your file in the MQL/Indicators folder via "Open Data Folder" and restart your terminal.
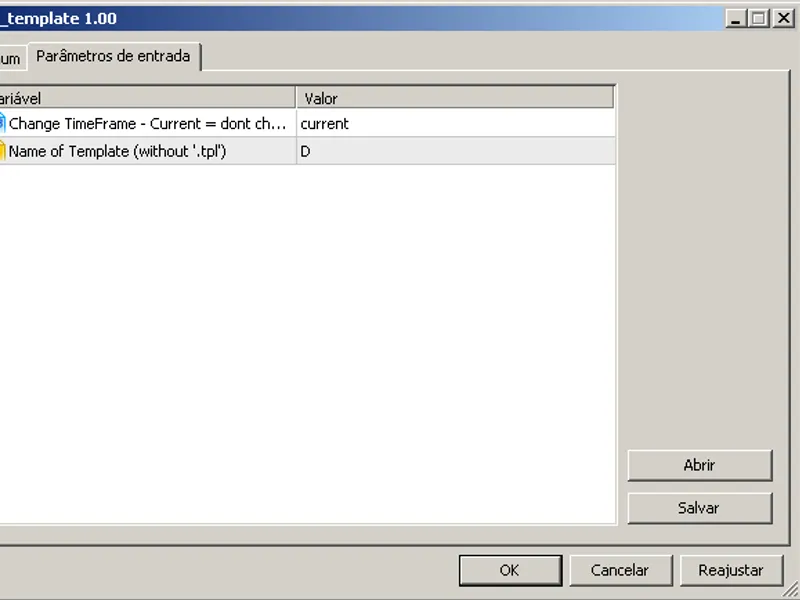
2. Loading: Find the indicator in the Navigator, drag it onto your chart, and configure the input parameters in the popup window.
3. Customization: Press Ctrl+I to open the indicator list, select your tool, and click "Properties" to change colors, levels, or visual styles.
4. Updating: Replace the old file in the Indicators folder with the new version and restart the platform to apply changes.
Frequently Asked Questions
Q: Why is my indicator not showing? A: Verify the file is in the MQL/Indicators folder, or try right-clicking the "Indicators" tree in the Navigator and clicking "Refresh."
Q: Do custom indicators slow down the platform? A: Too many complex indicators can impact performance; remove unused ones via the "Indicator List" (Ctrl+I).
Q: Can I use MT4 indicators on MT5? A: No, MQL4 and MQL5 are distinct languages; ensure the indicator is compiled specifically for your platform version.
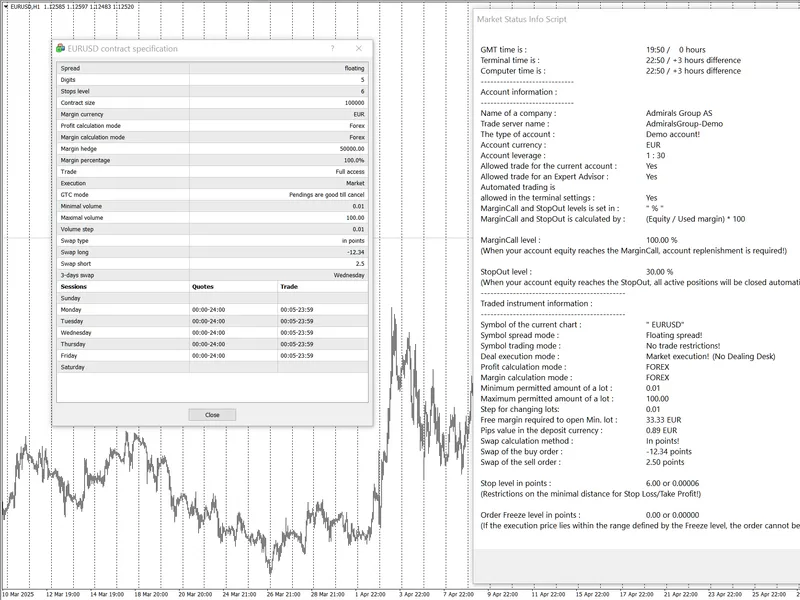
Description & Settings
Average Sentiment Oscillator
Momentum oscillator of averaged bull/bear percentages.
This is an improvement on the formula we used for the sentiment meter within FX Multimeter III. We suggest using it as a relatively accurate way to gauge the sentiment of a given period of candles, as a trend filter or for entry/exit signals.
It's a combination of two algorithms, both essentially the same but applied in a different way. The first one analyzes the bullish/bearishness of each bar using OHLC prices then averages all percentages in the period group of bars (eg. 10) to give the final % value. The second one treats the period group of bars as one bar and then determines the sentiment percentage with the OHLC points of the group. The first one is noisy but more accurate in respect to intra-bar sentiment, whereas the second gives a smoother result and adds more weight to the range of price movement. They can be used separately as Mode 1 and Mode 2 in the indicator settings, or combined as Mode 0.
Mode 1 - Intra-bar algorithm only - Leading Mode 2 - Group algorithm only - Lagging
Combining the two formulas we get the following result, which is the default Mode 0.
Mode 0 - Both algorithms - Balanced
Usage:
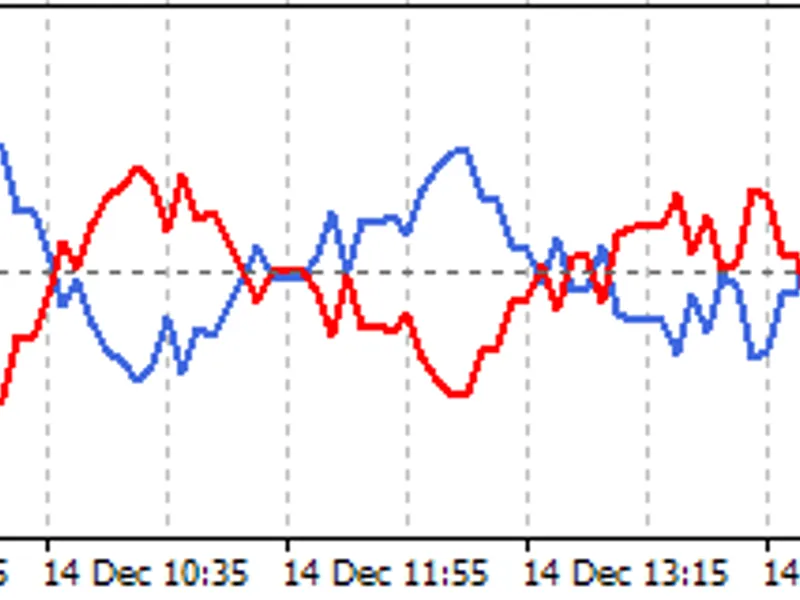
The blue line is Bulls %, red line is Bears %. As they are both percentages of 100, they mirror each other. The higher line is the dominating sentiment. The lines crossing the 50% centreline mark the shift of power between bulls and bears, and this often provides a good entry or exit signal, i.e. if the blue line closes above 50% on the last bar, Buy or exit Sell, if the red line closes above 50% on the last bar, Sell or exit Buy. These entries are better when average volume is high.
It's also possible to see the relative strength of the swings/trend, i.e. a blue peak is higher than the preceding red one. A clear divergence can be seen in the picture as the second bullish peak registers as a lower strength on the oscillator but moved higher on the price chart. By setting up levels at the 70% and 30% mark the oscillator can also be used for trading overbought/oversold levels similar to a Stochastic or RSI. As is the rule with most indicators, a smaller period gives more leading signals and a larger period gives less false signals.
Changing the fixed minimum and maximum values to 20 and 80 increases the oscillator width as pictured. Either of the lines can be hidden in the settings.
Our website -