Accumulation Swing Index (AS I)
This professional-grade solution for MetaTrader 5 helps traders achieve greater efficiency in their daily workflow. This technical indicator acts as a specialized analysis tool designed to visualize market data. It helps traders identify emerging trends, momentum shifts, and key support or resistance levels by plotting statistical calculations directly onto price charts.
How to Setup and Use Accumulation Swing Index (AS I)
1. Installation: Place your file in the MQL/Indicators folder via "Open Data Folder" and restart your terminal.
2. Loading: Find the indicator in the Navigator, drag it onto your chart, and configure the input parameters in the popup window.
3. Customization: Press Ctrl+I to open the indicator list, select your tool, and click "Properties" to change colors, levels, or visual styles.
4. Updating: Replace the old file in the Indicators folder with the new version and restart the platform to apply changes.
Frequently Asked Questions
Q: Why is my indicator not showing? A: Verify the file is in the MQL/Indicators folder, or try right-clicking the "Indicators" tree in the Navigator and clicking "Refresh."
Q: Do custom indicators slow down the platform? A: Too many complex indicators can impact performance; remove unused ones via the "Indicator List" (Ctrl+I).
Q: Can I use MT4 indicators on MT5? A: No, MQL4 and MQL5 are distinct languages; ensure the indicator is compiled specifically for your platform version.
Description & Settings
ASI was created by Welles Wilder as an ordinary fluctuations indicator that gets signals from previous maximums and minimums of price. Once, Wilder said: "Somewhere amidst the maze of Open, High, Low and Close prices is a phantom line that is the real market." What helps us reveal this phantom line is the accumulation index.
In his book "New Concepts in Technical Trading Systems", Wilder describes the indicator this way: "When the Index is plotted on the same chart as the daily bar chart, trend lines drawn on the ASI can be compared to trend lines drawn on the bar chart. For those who know how to draw meaningful trend lines, the ASI can be a good tool to confirm trend-line breakouts. Often erroneous breaking of trend lines drawn on bar charts will not be confirmed by the trend lines drawn on the ASI. Since the ASI is heavily weighted in favor of the close price, a quick run up or down during a day's trading does not adversely affect the index."
With the ASI attempting to show the "real market," it closely resembles actual prices. This allows usage of classic support/resistance analysis on the ASI. Standard analysis involves looking for breakouts, new highs and lows, and divergences. Wilder points out the following characteristics of ASI:
It gives quantitation parameters of price changing;
It shows the turning points of short-term changing;
It gives a possibility to understand the real power and trend of the market.
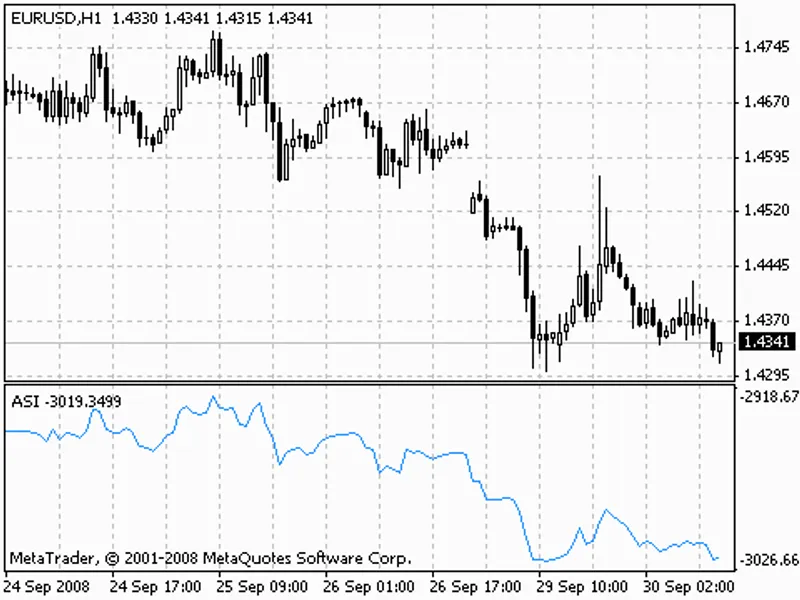
Accumulation Swing Index Indicator
Calculation:
SI(i)=50*(CLOSE(i-1)-CLOSE(i)+0,5*(CLOSE(i-1)-OPEN(i-1))+0,25*(CLOSE(i)-OPEN(i))/R)*(K/T)
ASI(i) = ASI(i-1) + SI(i)
where:
SI (i) - current value of Swing Index technical indicator;
SI (i-1) - stands for the value of Swing Index on the previous bar;
CLOSE (i) - current close price;
CLOSE (i-1) - previous close price;
OPEN (i) - current open price;
OPEN (i-1) — previous open price;
R - the parameter we get from a complicated formula based on the ratio between current close price and previous maximum and minimum;
K - the greatest of two values: (HIGH (i-1) - CLOSE (i)) and (LOW (i-1) - CLOSE (i));
T - the maximum price changing during trade session;
ASI (i) - the current value of Accumulation Swing Index.