MA Candles Two Colors
This professional-grade solution for MetaTrader 4 helps traders achieve greater efficiency in their daily workflow. This technical indicator acts as a specialized analysis tool designed to visualize market data. It helps traders identify emerging trends, momentum shifts, and key support or resistance levels by plotting statistical calculations directly onto price charts.
How to Setup and Use MA Candles Two Colors
1. Installation: Place your file in the MQL/Indicators folder via "Open Data Folder" and restart your terminal.
2. Loading: Find the indicator in the Navigator, drag it onto your chart, and configure the input parameters in the popup window.
3. Customization: Press Ctrl+I to open the indicator list, select your tool, and click "Properties" to change colors, levels, or visual styles.
4. Updating: Replace the old file in the Indicators folder with the new version and restart the platform to apply changes.
Frequently Asked Questions
Q: Why is my indicator not showing? A: Verify the file is in the MQL/Indicators folder, or try right-clicking the "Indicators" tree in the Navigator and clicking "Refresh."
Q: Do custom indicators slow down the platform? A: Too many complex indicators can impact performance; remove unused ones via the "Indicator List" (Ctrl+I).
Q: Can I use MT4 indicators on MT5? A: No, MQL4 and MQL5 are distinct languages; ensure the indicator is compiled specifically for your platform version.
Description & Settings
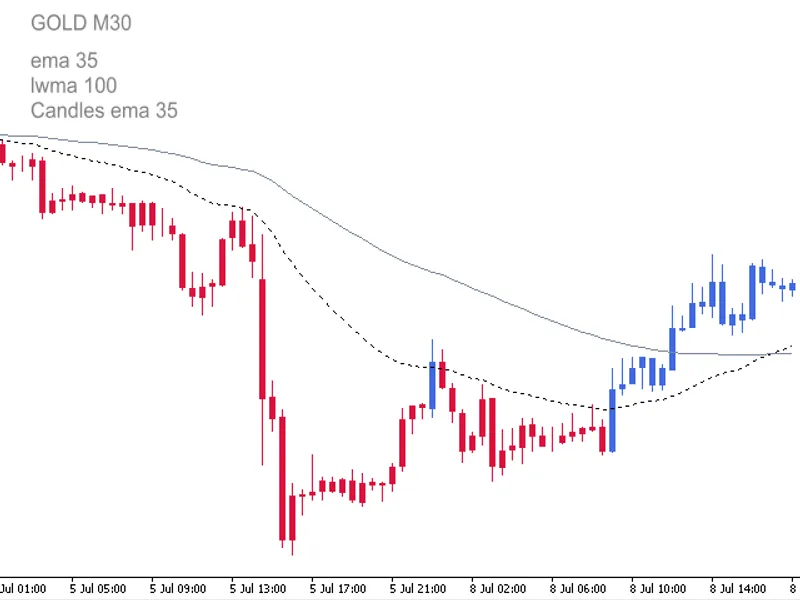
MA Candles Two Colors 2.0:
This indicator draws different colored candles above and below a Moving Average (MA) line.
Supported MA methods:
Simple
Exponential
Smoothed
Weighted
Triangular *.
The indicator includes all standard parameters of MA: Period, Shift, Method and Price.
* Triangular MA indicator is included — see attached download files.
The user is required to ensure that all Inputs Variables and Value parameters (MA Period, Shift, Method and Price) on both the present Indicator and the user provided Moving Average match each other exactly.
This indicator has been updated to automatically change the chart to a Line Chart and set the Line Chart to color None before drawing the MA Candles. Steps 1-7 are no longer necessary.
Open a new chart.
Change the chart price graphic to Line Chart - Press (Alt + 3) or locate 'Charts' on top menu and select 'Line Chart'. Make sure that 'Bar Chart' or 'Candlesticks' is not accidentally selected.
Open the Chart Properties window - press (F8) or right click anywhere on the chart and select 'Properties'.
Select the Colors tab.
Select 'Line Chart:', now select the '▼' and change color to 'None'. The chart should now have no graphical price displayed and is referred to as the blank chart.
A template of the blank chart can be made for further use with other currency pairs or instruments.
Attach Indicator Color Candles cross MA to the blank chart.
The default parameters for MA1 are: Period = 1, Shift = 0, Method = 0 (SMA), Price = 0 (Close). This is the equivalent of having the color candles change color on
price
close
above or below MA2.
The default method for MA2 is EMA.
Note: MAs to be supplied by user and not part of Indicator.
Candle Accuracy:
Although the standard chart price graphic is hidden it is not disabled and Open, High, Low and Close prices are available in MetaTrader 4 Data Window (press Ctrl+D or View → Data Window). Accuracy of the Indicators Open, High, Low and Close can be checked against Open, High, Low and Close in MetaTrader 4 Data Window. When cross-referencing the cursor point must be on the relevant colored candle:
Interpretation of the Data Windows:
The hidden candle Open: 1325.6
The hidden candle High: 1326.6
The hidden candle Low: 1321.5
The hidden candle Close: 1323.1
The indicator candle H, L, O and C are listed in Columns R up, R dn, Bu and B dn (Red up candle, Red down, Blue up candle, Blue down candle).
The hidden candle open is greater than the close so the candle is a down candle. The indicator Red down candle in column 2 corresponds to the hidden down candle.
R dn L: 1321.5
B dn H: 1326.6
R dn C: 1323.1
R dn O: 1325.6
All Inputs parameters and options can be changed and will save automatically. If after changing Inputs or Color parameters a Reset is used the Color Candles will display as Bars. To revert to Color Candles switch to a different timeframe and then back.
Input and Parameters:
Candle _MA_Period - 34;
Candle_MA_ Shift - 0;
Candle_MA_Type - 1;
Candle_MA_Price - 0;
Candle_Shadow_Width - 1;
Candle_Body_Width - 4;
Type_Key - 0: SMA, 1: EMA, 2: SMMA, 3: LWMA;
Price_Key - 0: Close, 1: Open; 2: High;
Price_Key_cont - 3: Low, 4: Median;