Geometric signal validation for indicator signals
This software component for MetaTrader 5 is built to enhance the capabilities of your trading environment. This technical indicator acts as a specialized analysis tool designed to visualize market data. It helps traders identify emerging trends, momentum shifts, and key support or resistance levels by plotting statistical calculations directly onto price charts.
How to Setup and Use Geometric signal validation for indicator signals
1. Installation: Place your file in the MQL/Indicators folder via "Open Data Folder" and restart your terminal.
2. Loading: Find the indicator in the Navigator, drag it onto your chart, and configure the input parameters in the popup window.
3. Customization: Press Ctrl+I to open the indicator list, select your tool, and click "Properties" to change colors, levels, or visual styles.
4. Updating: Replace the old file in the Indicators folder with the new version and restart the platform to apply changes.
Frequently Asked Questions
Q: Why is my indicator not showing? A: Verify the file is in the MQL/Indicators folder, or try right-clicking the "Indicators" tree in the Navigator and clicking "Refresh."
Q: Do custom indicators slow down the platform? A: Too many complex indicators can impact performance; remove unused ones via the "Indicator List" (Ctrl+I).
Q: Can I use MT4 indicators on MT5? A: No, MQL4 and MQL5 are distinct languages; ensure the indicator is compiled specifically for your platform version.
Description & Settings
It is known that many signal indicators produce false signals. Geometric signal validation is a means to remove these false signals in real-time and leave the other signals as they are. In geometric signal validation, a false signal is one which would produce a geometrically impossible zigzag leg. An indicator that would paint a buy signal when the market goes down has painted a geometrically invalid entry signal, and therefore you could respect that it is a false signal because of that. Geometrically invalid signals are essentially unsafe or false signals.
Knowing how many indicators are notorious for producing false signals, the signals that they immediately produce should not always be seen as entry signals, they should be seen as candidate signals.
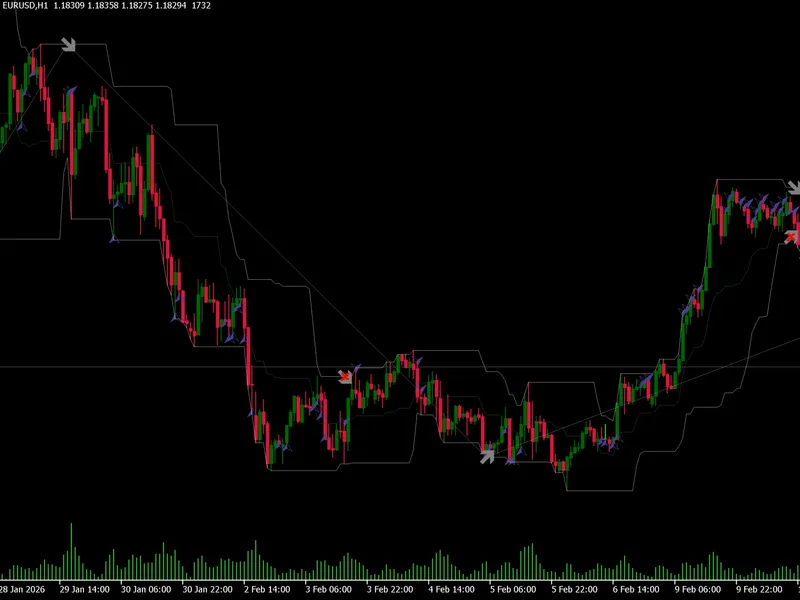
In this engine, signals that an indicator produces (in this case Donchian channel lines) are the candidates for low and high pivots. They all need to be validated. Zigzag-based logic is used to connect each of the candidate signals that the indicator produced, and if one of the candidates produces a geometric impossibility, it is seen as a false signal and the pivot search state remains unchanged.
When a zigzag comes to mind, you are probably imagining an indicator with logic driving the zigzag, but the script is flipped here, as this is not a zigzag, it is a validator.
When a leg concludes its search, it records the price, and changes search state. This change of search state is also the confirmation of the pivot. Confirmed pivots are marked with arrows, and geometric anomalies (the false/dangerous signals) are marked with arrows and an X graphic striking through it.
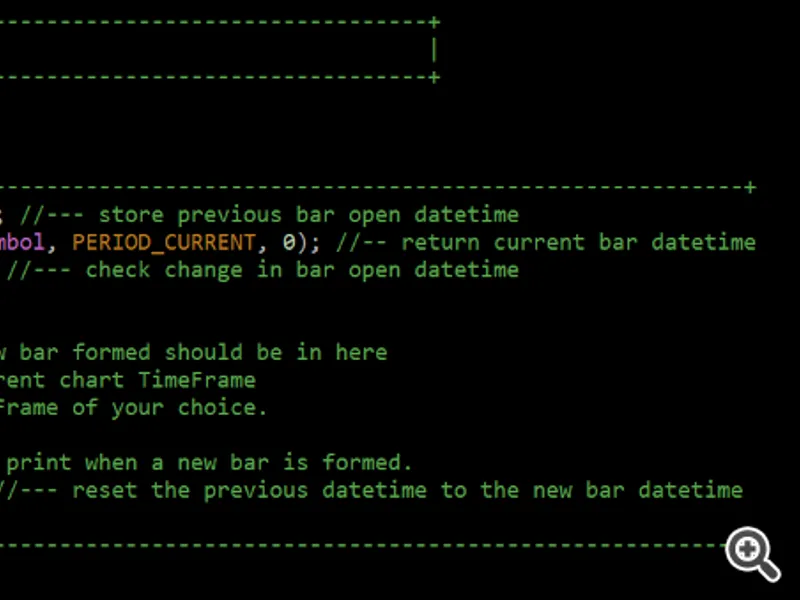
The signal validation can be done on any signal indicators, the Donchian channel is used here for example purposes. To understand it more clearly, you can study the code which I commented, and also run it visually in the strategy tester.