Fractal
This tool for MetaTrader 4 is specifically engineered to streamline your trading operations. This technical indicator acts as a specialized analysis tool designed to visualize market data. It helps traders identify emerging trends, momentum shifts, and key support or resistance levels by plotting statistical calculations directly onto price charts.
How to Setup and Use Fractal
1. Installation: Place your file in the MQL/Indicators folder via "Open Data Folder" and restart your terminal.
2. Loading: Find the indicator in the Navigator, drag it onto your chart, and configure the input parameters in the popup window.
3. Customization: Press Ctrl+I to open the indicator list, select your tool, and click "Properties" to change colors, levels, or visual styles.
4. Updating: Replace the old file in the Indicators folder with the new version and restart the platform to apply changes.
Frequently Asked Questions
Q: Why is my indicator not showing? A: Verify the file is in the MQL/Indicators folder, or try right-clicking the "Indicators" tree in the Navigator and clicking "Refresh."
Q: Do custom indicators slow down the platform? A: Too many complex indicators can impact performance; remove unused ones via the "Indicator List" (Ctrl+I).
Q: Can I use MT4 indicators on MT5? A: No, MQL4 and MQL5 are distinct languages; ensure the indicator is compiled specifically for your platform version.
Description & Settings
If you find this indicator useful, you can show your support by giving a star to its and this post. You are more than welcome to comment below this post for reporting bugs, or suggesting any further improvements that you may find useful. You can do the same by opening an issue on the GitHub repository. You can also contribute to the source code by making a pull request on the GitHub repository.
Installation
Run MetaTrader and navigate to your MetaTrader data folder through the menu bar by selecting File -> Open Data Folder . Copy Fractal-Utilities.mqh into MQL4\Include folder, and copy Fractal-STF.mq4 and Fractal-MTF.mq4 into MQL4\Indicators folder. The final step is to compile Fractal-STF.mq4 and Fractal-MTF.mq4 via
MetaEditor
to create Fractal-STF.ex4 and Fractal-MTF.ex4 , respectively. Now, you should be able to use the Fractal-STF and Fractal-MTF indicators within MetaTrader terminal. The only requirement for installation is to put both Fractal-STF.mq4 and Fractal-MTF.mq4 into the same directory, which can be any subdirectory of MQL4\Indicators like MQL4\Indicators\Developed . Note that whenever you relocate the compiled files to another directory, you should recompile them in that directory to get them working.
Description
There is a built-in fractal indicator in MT4/MT5, whose origins goes back to the famous Bill Williams. The main purpose of this indicator is to identify a local extremum by comparing a candle's high/low with that of its neighboring candles to justify it as an up-fractal/down-fractal, a term coined by Williams instead of local maximum/minimum. Some other equivalent terms are swing high/low and top/bottom, which are used among traders interchangeably.
This indicator has the following advantages over its built-in MT4/MT5 counterpart:
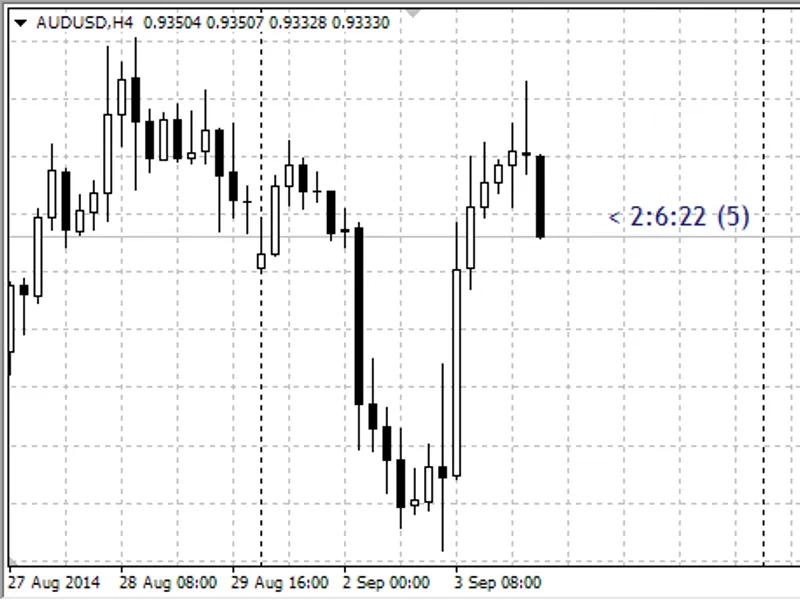
1. Williams believed that like our middle finger, which is a fractal compared with its two neighboring ones, the radius of the comparison should be chosen as two, which is the default value for the built-in fractal indicator in MT4/MT5. In this indicator, the user can choose this neighborhood radius to his/her will. This has the benefit of distinguishing extrema of different degrees at the same time on the chart as shown in
Figure 1
.
2. User can also choose the shape of symbols pointing to these extrema, enabling him/her to associate with extrema of each degree a unique symbol for better visualization.
3. User can specify the vertical distance of the arrows from the high/low of the candles to avoid overlapping of symbols corresponding to extrema of different degrees. The idea for dynamic adjustment of the vertical distance was mainly inspired by the answers of tdbarnard in . The main point to consider is that we want the
pixel distance
of an arrow (arrow offset) to be a constant value away from a candle's high/low. However, this does not mean that the equivalent
price distance
should be constant too. Indeed, as the chart's scale is changed, the price distance corresponding to a fixed pixel distance will also change, which requires a dynamic distance adjustment. You can see the detailed implementation of this idea in the code.
4. User can view higher time frame fractals in a lower time frame, making this a multi time frame (MTF) indicator. For example, user can set the indicator time frame as D1 and choose a radius of 2 for the fractals. Next, if user switches to M15 time frame, Fractal-MTF marks those M15 bars whose high/low coincides with that of their corresponding fractals in D1 time frame. Note that the indicator time frame should be greater than or equal to the chart time frame, which is attached to it. If the user chooses an indicator time frame smaller than the chart time frame, then the indicator uses the chart time frame by default.
Figure 1
. Fractals with neighborhood radius of 2 and 5.
Figure 2.
Inputs of the Fractal-MTF indicator.