Figurelli RS I
This is a powerful addition to your MetaTrader 4 toolkit designed to optimize market analysis and performance. This technical indicator acts as a specialized analysis tool designed to visualize market data. It helps traders identify emerging trends, momentum shifts, and key support or resistance levels by plotting statistical calculations directly onto price charts.
How to Setup and Use Figurelli RS I
1. Installation: Place your file in the MQL/Indicators folder via "Open Data Folder" and restart your terminal.
2. Loading: Find the indicator in the Navigator, drag it onto your chart, and configure the input parameters in the popup window.
3. Customization: Press Ctrl+I to open the indicator list, select your tool, and click "Properties" to change colors, levels, or visual styles.
4. Updating: Replace the old file in the Indicators folder with the new version and restart the platform to apply changes.
Frequently Asked Questions
Q: Why is my indicator not showing? A: Verify the file is in the MQL/Indicators folder, or try right-clicking the "Indicators" tree in the Navigator and clicking "Refresh."
Q: Do custom indicators slow down the platform? A: Too many complex indicators can impact performance; remove unused ones via the "Indicator List" (Ctrl+I).
Q: Can I use MT4 indicators on MT5? A: No, MQL4 and MQL5 are distinct languages; ensure the indicator is compiled specifically for your platform version.
Description & Settings
The original RSI
In my opinion, Welles Wilder RSI (Relative Strength Index) is a great momentum oscillator that works fine for small periods values (from 2 to 20).
The proposed RSI
The main idea of the proposed RSI is better detect the signal overbought/oversold situations using larger periods for better trend detection in any timeframe.
For this, I did some changes to it performe as good for greater periods, like 120, introducing a gain variable.
So, if you use 120 period in original Wilder RSI, you can inject a gain to see the graph as well as small periods.
Parameters description:
- period: original RSI period
- gain: gain injected for greater periods better visualization
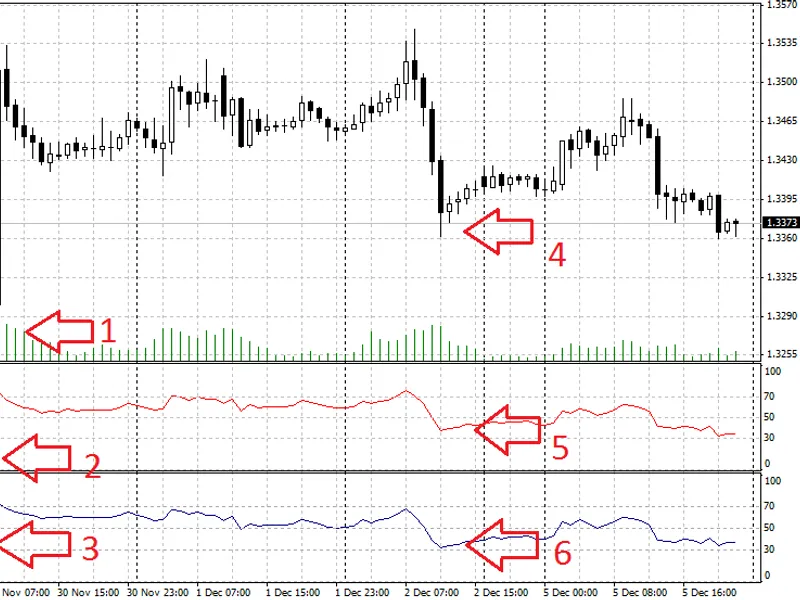
Example 1: the advantage of larger periods using Wilder RSI gain injection in EUR/USD H1
- in the graph we have the two indicators comparison: Wilder RSI (blue) x Figurelli RSI (red)
- our target is better detect signal points [1] and [4]
- note that original RSI with period 14 detects points [3] and [6] are almost the same, but points [1] and [4] are very differents
- in Figurelli RSI with period 120 and gain 10, we can see points [2] and [5] that better detect the signal overbought/oversold situations
Example 2: the advantage of larger periods using Wilder RSI gain injection in EUR/USD D1
- same as example 1, in the graph we have the two indicators comparison: Wilder RSI (blue) x Figurelli RSI (red)
- our target is better detect signal points [1], [2] and [3]
- note that for Wilder RSI point [1] is oversold, while in Figurelli RSI point [2] is oversold
Adjustment tips:
- if you use gain 1 the Figurelli RSI will be equal to Wilder RSI
- if you increase your period, tries to increase the gain, so for 120 period you can try gain 10 to better see the great Wilder RSI visibility even in greater periods