Pivot Point with adjustable closing time
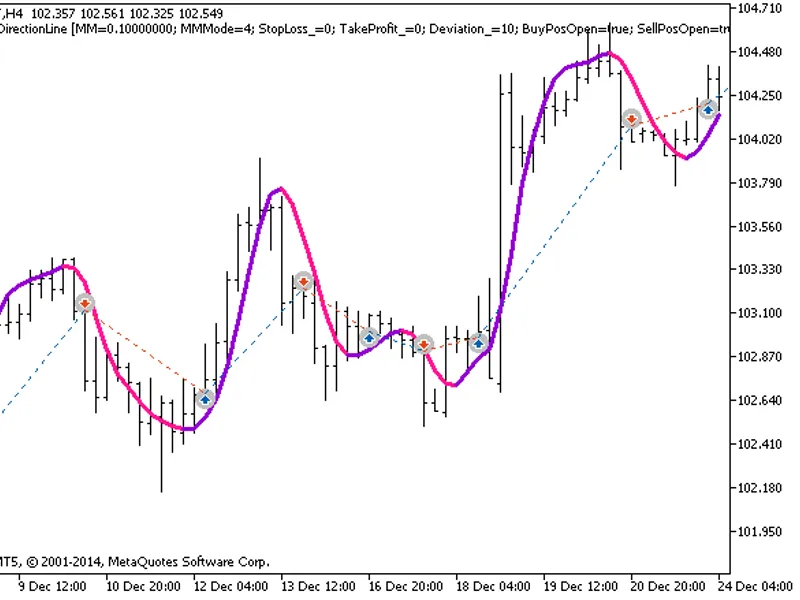
This software component for MetaTrader 4 is built to enhance the capabilities of your trading environment. This technical indicator acts as a specialized analysis tool designed to visualize market data. It helps traders identify emerging trends, momentum shifts, and key support or resistance levels by plotting statistical calculations directly onto price charts.
How to Setup and Use Pivot Point with adjustable closing time
1. Installation: Place your file in the MQL/Indicators folder via "Open Data Folder" and restart your terminal.
2. Loading: Find the indicator in the Navigator, drag it onto your chart, and configure the input parameters in the popup window.
3. Customization: Press Ctrl+I to open the indicator list, select your tool, and click "Properties" to change colors, levels, or visual styles.
4. Updating: Replace the old file in the Indicators folder with the new version and restart the platform to apply changes.
Frequently Asked Questions
Q: Why is my indicator not showing? A: Verify the file is in the MQL/Indicators folder, or try right-clicking the "Indicators" tree in the Navigator and clicking "Refresh."
Q: Do custom indicators slow down the platform? A: Too many complex indicators can impact performance; remove unused ones via the "Indicator List" (Ctrl+I).
Q: Can I use MT4 indicators on MT5? A: No, MQL4 and MQL5 are distinct languages; ensure the indicator is compiled specifically for your platform version.
Description & Settings
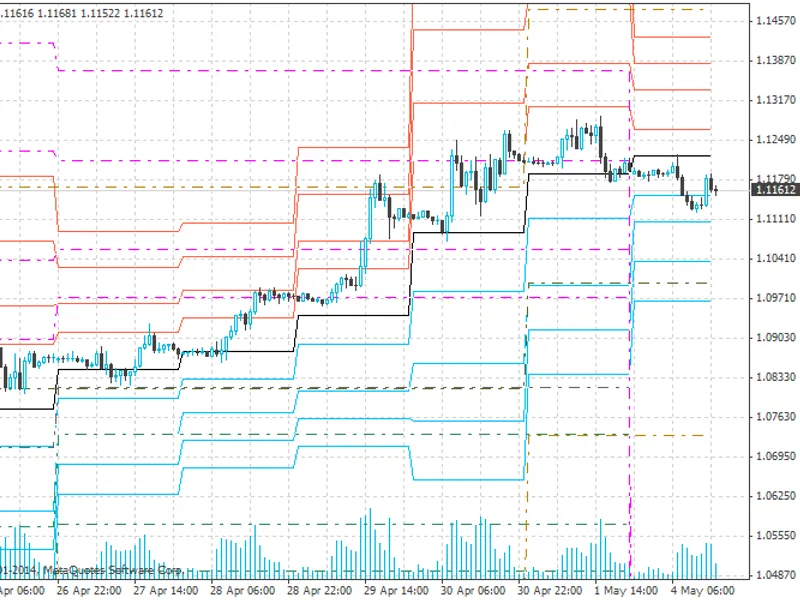
PP indicator on daily (weekly, monthly) level,
for use in timeframes smaller than daily
. I'll skip the part discussing its basic use in trading, you can find that information here:
Custom deviations from ordinary PP indicators:
Sunday bars for those data feeds starting on sundays at 22:00 UTC eliminated.
Close time used for calculation is close of 20:00 UTC bar; it is an input variable and can easily be changed when indicator is attached to chart (input int closetime_UTC).
This indicator shows daily PP which are calculated on basis of closing price of a preceding trading days' adjustable hourly bar. This is very useful if you wish to take, for example, New Yorks' closing price and not the rather deliberate one of wherever you live or where your broker operates from. The original settings are designed for UTC time zone.
A special challenge lies in the sunday bars that my broker supplies. They are eliminated in this indicator and are displayed in the same way as mondays.
Often the weekly and monthly PP give additional hints for technical analysis. Therefore it is possible to have them displayed as well (see according input variables). You can also have the midpoints for the current day displayed.
To achieve these premises, the PP are calculated differently for mondays and sundays. The calculation thus determines TimeDayOfWeek in a switch, and the formulae slightly differ from each other as needed. The trick used (of which I'm not sure whether it was smart at all) is to determine the actual amount of bars in the hourly timeframe (variable hshift) until day start. To this hourly shift, the needed amount of hourly bar shift is added in order to get the interesting bar whose closing time is used for PP calculation.
There is an important restriction to the indicator:
As it is calculated on hourly level, it delivers indicator values that are totally off track when the amount of hourly bars that is usually provided is 'used up'. In my case, this is something above three thousand and five hundred hours, but this value might be different with other brokers. In order to keep the chart clean, I decided to let the drawing be cut off before the wrong values start. However, they are still there in the arrays!
I think the code is fairly commented and look forward to your benevolent criticism, in order to improve the indicator. If you like it, please rate the indicator in the Code Base and recommend it to your friends!