BW-Zone
This tool for MetaTrader 4 is specifically engineered to streamline your trading operations. This technical indicator acts as a specialized analysis tool designed to visualize market data. It helps traders identify emerging trends, momentum shifts, and key support or resistance levels by plotting statistical calculations directly onto price charts.
How to Setup and Use BW-Zone
1. Installation: Place your file in the MQL/Indicators folder via "Open Data Folder" and restart your terminal.
2. Loading: Find the indicator in the Navigator, drag it onto your chart, and configure the input parameters in the popup window.
3. Customization: Press Ctrl+I to open the indicator list, select your tool, and click "Properties" to change colors, levels, or visual styles.
4. Updating: Replace the old file in the Indicators folder with the new version and restart the platform to apply changes.
Frequently Asked Questions
Q: Why is my indicator not showing? A: Verify the file is in the MQL/Indicators folder, or try right-clicking the "Indicators" tree in the Navigator and clicking "Refresh."
Q: Do custom indicators slow down the platform? A: Too many complex indicators can impact performance; remove unused ones via the "Indicator List" (Ctrl+I).
Q: Can I use MT4 indicators on MT5? A: No, MQL4 and MQL5 are distinct languages; ensure the indicator is compiled specifically for your platform version.
Description & Settings
In essence, it implements the idea of visual interpretation of the state of the fourth dimension of the Chaos Theory by B. Williams - Zone.
Information on the Chaos Theory in general and the on logic of determining its state in particular can be found .
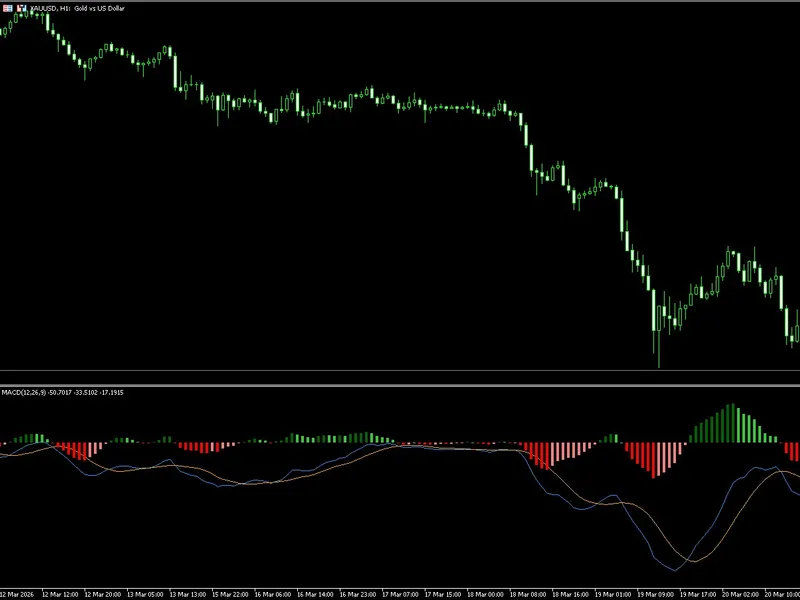
In short, the state of the zone is determined based on the values of two indicators: Awesome Oscillator and Acceleration/Deceleration. Both are included in the standard package of the MetaTrader (Insert - Indicators - B. Williams).
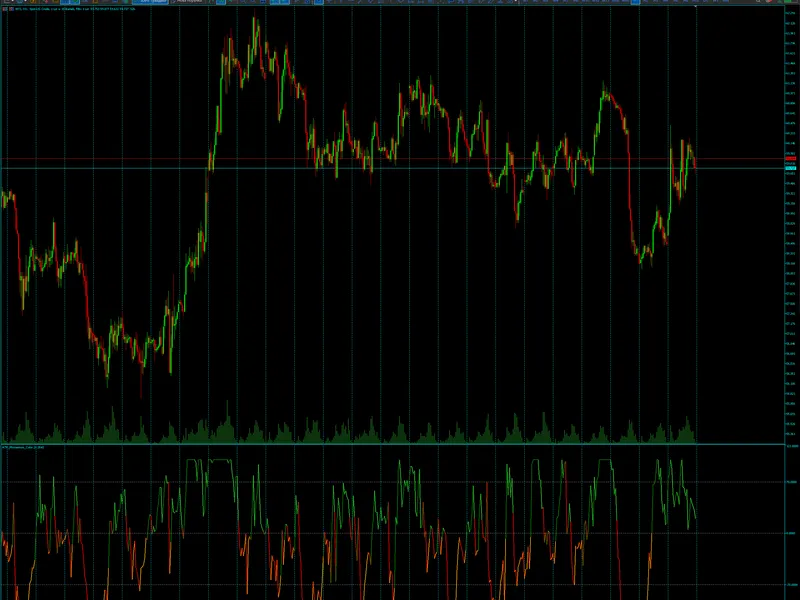
When the driving force (Awesome Oscillator — AO) and acceleration (Acceleration/Deceleration — AC) are in the same direction (both green or both red) — it means that the driving force not only moves in that direction, but also accelerates.
If the current AC and AO columns are green, this indicates the green zone. For clarity, this bar can be colored in green. If the current AC and AO columns are red, this indicates the red zone. For clarity, this bar can be colored in red. If the AC and AO columns have different directions, the bar is colored in gray (gray zone).