Brooky Psar Levels
This tool for MetaTrader 4 is specifically engineered to streamline your trading operations. This technical indicator acts as a specialized analysis tool designed to visualize market data. It helps traders identify emerging trends, momentum shifts, and key support or resistance levels by plotting statistical calculations directly onto price charts.
How to Setup and Use Brooky Psar Levels
1. Installation: Place your file in the MQL/Indicators folder via "Open Data Folder" and restart your terminal.
2. Loading: Find the indicator in the Navigator, drag it onto your chart, and configure the input parameters in the popup window.
3. Customization: Press Ctrl+I to open the indicator list, select your tool, and click "Properties" to change colors, levels, or visual styles.
4. Updating: Replace the old file in the Indicators folder with the new version and restart the platform to apply changes.
Frequently Asked Questions
Q: Why is my indicator not showing? A: Verify the file is in the MQL/Indicators folder, or try right-clicking the "Indicators" tree in the Navigator and clicking "Refresh."
Q: Do custom indicators slow down the platform? A: Too many complex indicators can impact performance; remove unused ones via the "Indicator List" (Ctrl+I).
Q: Can I use MT4 indicators on MT5? A: No, MQL4 and MQL5 are distinct languages; ensure the indicator is compiled specifically for your platform version.
Description & Settings
Additional levels have been added that were missing from the original and the psar settings are optimized for H1 and H4 in particular.
The main goal of this indicator is to try and find confluence from previous psar switches and by plotting these levels find areas of potential reversal or re-evaluation
of trades. It can be used to follow trends with trailing stops at previous levels on a smaller time-frame or the plotted psar, though the psar trail can often leave a lot on the table.
It offers a simple yet effective method of plotting support and resistance levels based on a consistent logic so that you can use your favorite indicators against the levels to look for trades.
It is beneficial to run the indicator on both H1 and H4 and make judgements based on both time-frames.
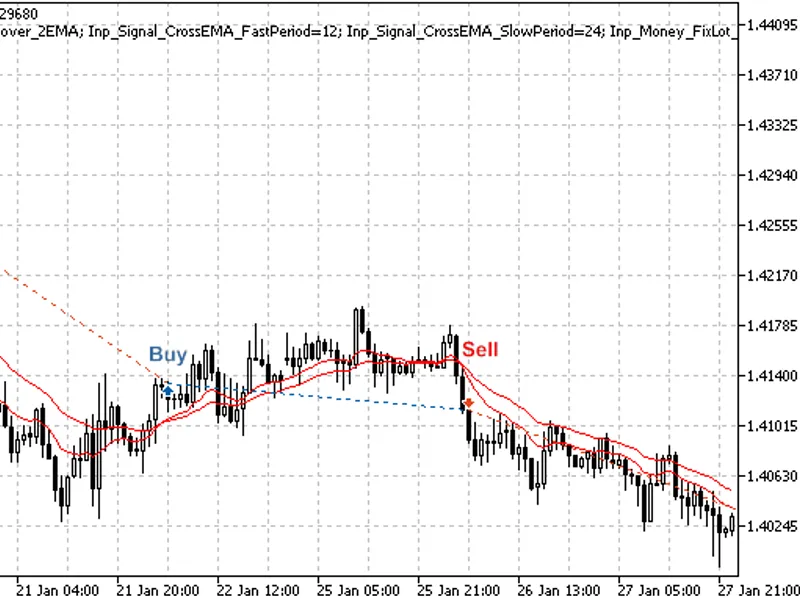
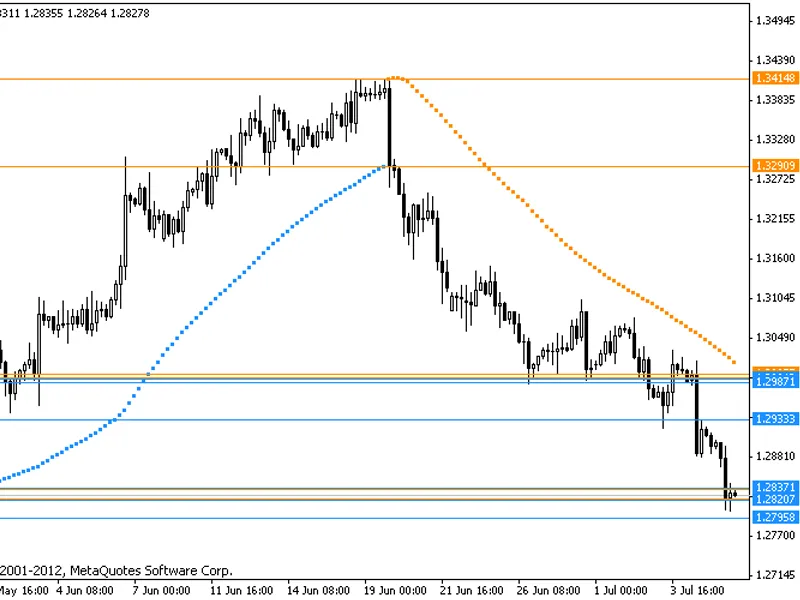
The attached image is a good example how two confluent areas played their part in a big EurUsd short. Upon establishing the 2nd top level at 1.32909 there was a small retrace and then the drop.
That retrace is quite typical behavior and it will generally break hard back into or reverse the trend. Enjoy.
Image: