BO B B
This software component for MetaTrader 4 is built to enhance the capabilities of your trading environment. This technical indicator acts as a specialized analysis tool designed to visualize market data. It helps traders identify emerging trends, momentum shifts, and key support or resistance levels by plotting statistical calculations directly onto price charts.
How to Setup and Use BO B B
1. Installation: Place your file in the MQL/Indicators folder via "Open Data Folder" and restart your terminal.
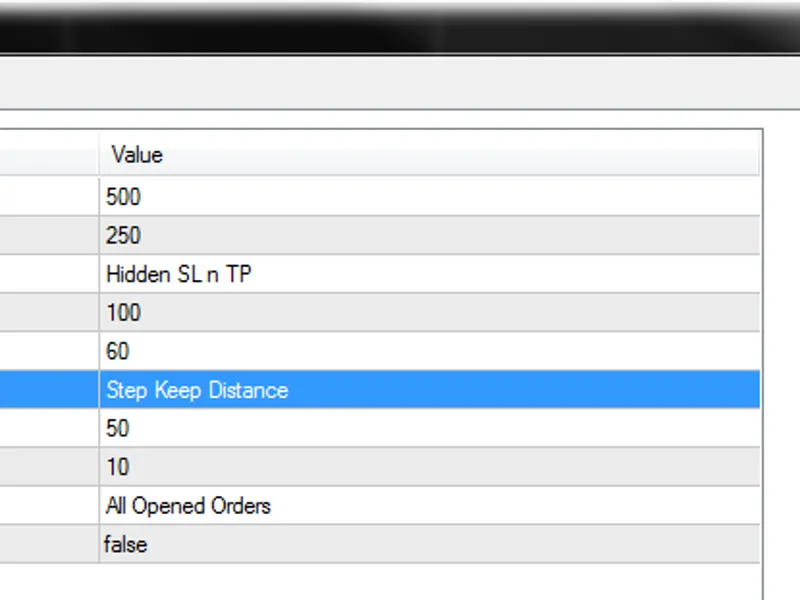
2. Loading: Find the indicator in the Navigator, drag it onto your chart, and configure the input parameters in the popup window.
3. Customization: Press Ctrl+I to open the indicator list, select your tool, and click "Properties" to change colors, levels, or visual styles.
4. Updating: Replace the old file in the Indicators folder with the new version and restart the platform to apply changes.
Frequently Asked Questions
Q: Why is my indicator not showing? A: Verify the file is in the MQL/Indicators folder, or try right-clicking the "Indicators" tree in the Navigator and clicking "Refresh."
Q: Do custom indicators slow down the platform? A: Too many complex indicators can impact performance; remove unused ones via the "Indicator List" (Ctrl+I).
Q: Can I use MT4 indicators on MT5? A: No, MQL4 and MQL5 are distinct languages; ensure the indicator is compiled specifically for your platform version.
Description & Settings
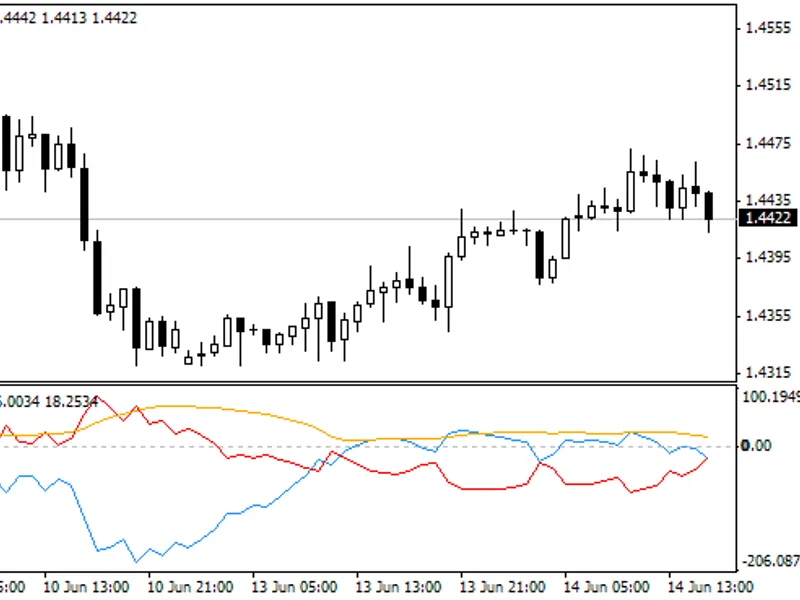
My intention was to write an indicator that shows Bollinger Bands ® breakouts and the width of the bands. So there was v1. Orange line shows width.
If blue line crosses zeroline to above its a breakout to above and if red line crosses zeroline to above its a breakout to below.
I liked the signals which are generated by crossover of the two lines so I decided to make a v2 with the difference of the two lines and I added a MA.
Orange line same as in v1.
Blue line is the difference of the two lines in v1.
Crossing zeroline to below -> short, crossing to above -> long.
And red line is MA.
As I finished coding I recognized that the blue line just shows the difference between price and MA20 but as you can see it shows pretty good signals no matter if one is trading the crossing of zeroline or crossing the MA and there are usefull divergences too.
Happy trading