Basket Viewer-View Statistics on groups of Long and Short Pairs
This tool for MetaTrader 4 is specifically engineered to streamline your trading operations. This technical indicator acts as a specialized analysis tool designed to visualize market data. It helps traders identify emerging trends, momentum shifts, and key support or resistance levels by plotting statistical calculations directly onto price charts.
How to Setup and Use Basket Viewer-View Statistics on groups of Long and Short Pairs
1. Installation: Place your file in the MQL/Indicators folder via "Open Data Folder" and restart your terminal.
2. Loading: Find the indicator in the Navigator, drag it onto your chart, and configure the input parameters in the popup window.
3. Customization: Press Ctrl+I to open the indicator list, select your tool, and click "Properties" to change colors, levels, or visual styles.
4. Updating: Replace the old file in the Indicators folder with the new version and restart the platform to apply changes.
Frequently Asked Questions
Q: Why is my indicator not showing? A: Verify the file is in the MQL/Indicators folder, or try right-clicking the "Indicators" tree in the Navigator and clicking "Refresh."
Q: Do custom indicators slow down the platform? A: Too many complex indicators can impact performance; remove unused ones via the "Indicator List" (Ctrl+I).
Q: Can I use MT4 indicators on MT5? A: No, MQL4 and MQL5 are distinct languages; ensure the indicator is compiled specifically for your platform version.
Description & Settings
This utility allows monitoring of multiple symbols and positions on one chart, with one group for long (buy) symbols, and another group for short (sell) symbols. There are 7 default symbol pairs in each of the groups. The user may change these and enter up to 50 symbols from their market watch in either of the long or short basket for viewing.
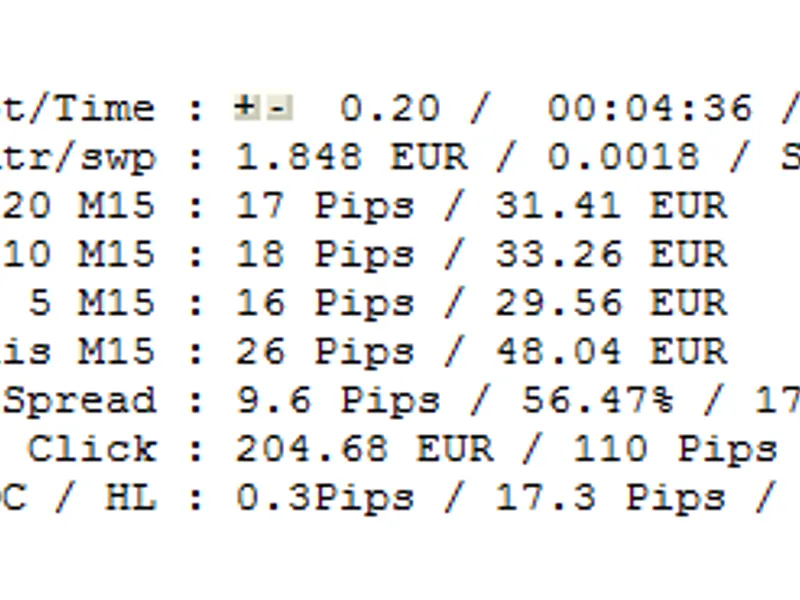
The current display chart can be changed to any of the symbols symbols in the indicator display with a click on the symbol. Statistics including ATR for the chart period, points gained or lost from a weeks start and position gains or losses and lots exposure are displayed. The statistics week may be changed with simple clicks on the display, and the display may be dragged and dropped to a different location. The load on quote processing is kept low by simply posting an event that starts the processing for a display update instead of running the update inline with the quote processing.
Here are descriptions of the main controls and features of the display - The first two lines have the 'control objects ( full picture below):
"Basket Viewer (wk 0): 2019.05.19 - 2019.05.26"
Click "Basket Viewer" to select the object and drag and drop the panel to a different location on the chart.
Click the first date (2019.05.19) to increment the week being displayed.
Click the 2nd date (2019.05.26) to decrement the week being displayed.
"BUY BASKET Points Bskt_ATR Pos_Prft Pos_lots"
Click this line to highlight the currently selected week on the chart (draws a rectangle over the week). Click a 2nd time to remove the rectangle.
"BUY BASKET" is the list of pairs extracted from the User controllable "Buy Pairs String". Click the individual 'pairs strings' to change the chart to that symbol.
"Points" is the Open of the week subtracted from the close of the week (close - open). This is based on the week selected, (default is week 0, the current week).
"Bskt_ATR" is the atr for the symbol for the week in the chart's time frame. This is based on the week selected, (default is week 0, the current week).
"Pos_Prft" is the profit or loss from any active trades on the symbol. In the picture, there is a $150.07 profit on GBPJPY. This does not change based on week selected.
"Pos_Lots" is the exposure to the indicated symbol. In the picture, there is a 1 lot exposure shown on GBPJPY. This does not change based on week selected.
As can by seen in the below display, this header is followed by the buy pairs statistics, including a total for the Points, ATR, Prft and Lots columns.
"SELL_BASLET Points Bskt_ATR Pos_Prft Pos_Lots"
This is a repeat of the "BUY Basket" header for the "Sell Pairs String". There are no event actions for clicking this display line. As can by seen in the below display, this header is followed by the sell pairs statistics, including a total for the Points, ATR, Prft and Lots columns. The totals are opposite from the Buy Basket - for example, profit points are (open - current/close) price for the week, versus (current/close - open) for the Buy Basket.
Clicking on any of the "Symbol Pairs" changes the chart to that symbol pair.